GMO’s Ben Inker had a new piece out this week, and sticking with the firm’s theme from the past few years, he’s doing his best to lower investor expectations:
In today’s world, where prices of all sorts of assets are trading far above historical norms, it is worth recognizing that investors prepared to buy assets without regard to the price of those assets may also find themselves in a position to sell those assets without regard to price as well. […]
Making matters worse, in order to see massive changes in the price of a security, you don’t need the price-insensitive buyer to become a seller. You merely need him to cease being the marginal buyer. If price-insensitive buyers actually become price-insensitive sellers, it becomes possible that price falls could take asset prices significantly below historical norms.
My first thought is that there have always been price insensitive buyers and sellers of stocks. There’s never been a time when every investor made rational, fundamentally-based buy and sell decisions. In the past it was brokers who were making these price insensitive recommendations on behalf of their unsuspecting clients. Today it’s just much easier for people to make changes to their own investment accounts.
But price insensitivity is nothing new for either buyers or sellers. Anyone who’s studied market history knows that people always go overboard in both directions. Certain investors will always get too excited or panic at the wrong times — it’s human nature.
There are many investors these days who share Inker’s concerns. No one likes losing money after all. It’s hard to go a single day without reading a comparison to 1929, 1972, 1987, 2000 or 2007. Those peaks look so easy to call in hindsight that investors are constantly thinking about the next huge crash in the hopes of getting out before the carnage hits.
For argument’s sake, let’s say all of these people that have been predicting a crash since 2010 or so are finally right and the next market peak is just around the corner. Are price insensitive buyers doomed? As usual, it depends.
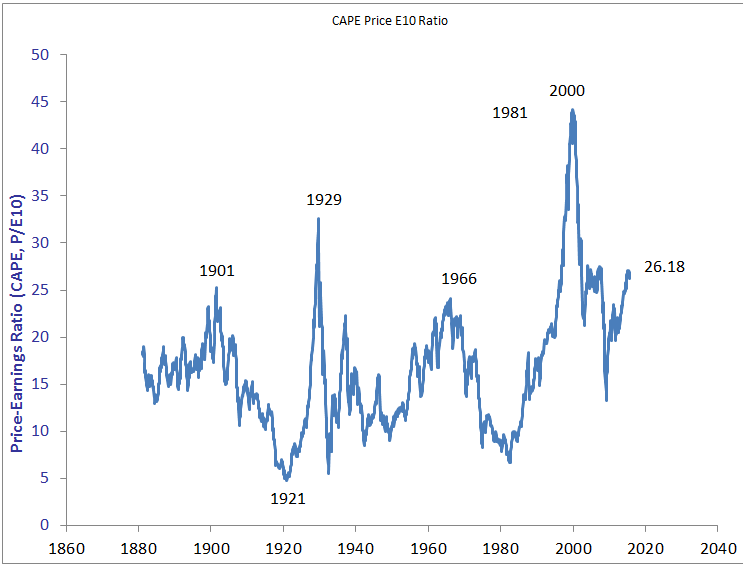
The 1929-1932 period is the mother of all stock market crashes, with stocks falling more than 80% during the early stages of the Great Depression. Looking back at Robert Shiller’s historical CAPE ratio shows how pronounced that peak was in terms of overvaluation. Only the tech bubble in 2000 was more overvalued by this measure:
The returns following this crash were absolutely brutal. Five year annual real returns were down double digits and even ten year returns showed losses of around -2% per year. But five and ten year returns are relatively small time frames in the grand scheme of things if you’re a long-term stock investor (although not many people would agree with me on this). What if you were a price insensitive buyer who held on through the crash? The long-term returns actually weren’t that bad:
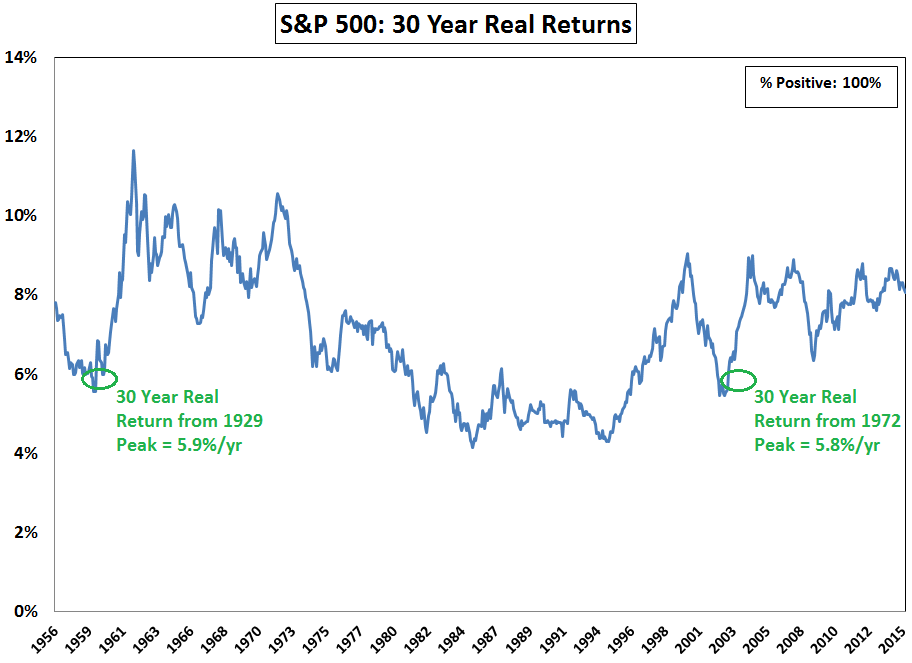
It’s hard to believe, but real returns starting at the peaks in 1929 and even 1972, just before two of history’s worst market crashes, were actually better than roughly 25% of all rolling 30 year periods. Some people say that long-term stock returns don’t matter because no one has a long enough time horizon to earn those kinds of returns. I’d argue anyone saving for retirement has a minimum of a 30 year time horizon, especially if you include your retirement years.
I’m not saying you should close your eyes and buy stocks hand over fist just because investing at prior peaks has worked out in the past for investors with extreme levels of patience. What I am saying is that you have to always understand and define your time horizon when making investment decisions. Your holding period matters, as does your liquidity to meet your interim spending needs.
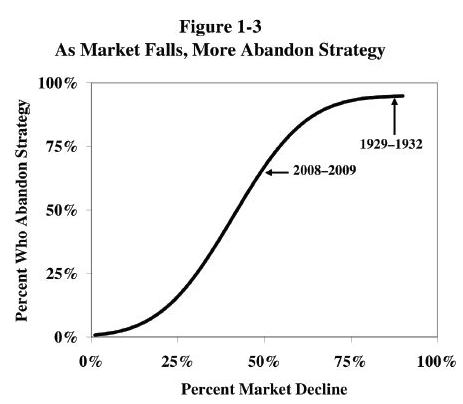
Although it’s quite possible that no one would have had the discipline to be able to stick with stocks during the Great Depression. William Bernstein posted a fairly sobering chart in his book, Rational Expectations, where he estimates the number of investors who will abandon their strategy depending on the magnitude of the market decline:
If you’re a long-term holder of stocks you have to be able to look past poor five or even ten year periods at times, but most investors don’t have that level of discipline. This is why it makes sense to diversify your portfolio beyond stocks if you don’t have the ability to see things through these types of market environments.
No one is guaranteed historical market returns going forward, but things may not be as dire as some predict depending on how you look at things. Either way, no one knows for certain how things will play out, no matter how confident they may sound with their forecasts.
Everyone is sensitive to market prices depending on their threshold for pain. How much pain you’re willing to endure usually has a lot to do with how much gain you’ll eventually end up with.
Sources:
GMO Quarterly Letter
Rational Expectations: Asset Allocation for Investing Adults
Further Reading:
What Constitutes Long-Term in the Stock Market?
So You Want to be a Top Caller?
Subscribe to receive email updates and my quarterly newsletter by clicking here.
Follow me on Twitter: @awealthofcs
My new book, A Wealth of Common Sense: Why Simplicity Trumps Complexity in Any Investment Plan, is out now.

Ben Inker’s colleague at GMO, Jeremy Grantham, writes frequently about the anomaly of the US presidential cycle. Average returns in pre-election years are so much higher than in the two post-election years, that the divergence appears to have statistical significance.
2015 is a pre-election year, and so was 1987. Like this year, 1987 started out as a weak year for bonds. By August 1987, the Lehman Aggregate was down 1.32% year to date (compared to a feeble 0.59% gain in 2015 YTD). Adding to the fixed income pain, the FOMC cranked the discount rate a half point higher on Sep. 4, 1987, from 5.5% to 6.0%. Six weeks later, stocks had crashed 36% from their Aug 25, 1987 high.
Should the FOMC hike its policy rate on Sep 17, 2015 under similar conditions of lofty stock valuations, an historical analogy comes into play. In 1987, an effective defense against a hostile Fed was to sell stocks and buy bonds, which rose about 6% in 4Q 1987. Will it work again in 2015, if the Fed commits the same error at the same point in the presidential cycle?
I cite the analogy purely for entertainment purposes. But it’s not just a joke, either. Real folks got real money at risk here!
Definitely a scary parallel. I’m of the opinion that it would be tough for the Fed to raise rates next year politically because it’s an election year, but anyone’s opinion on rate hikes should be taken with a bucket of salt.
I’m crazy, but maybe an ’87 repeat wouldn’t be the worst thing in the world:
https://awealthofcommonsense.com/repeat-1987-crash-really-bad/
This is why I believe value investing (index investing) will work in the future too. It is easy to understand but damned hard to follow so a lot of value index investors will fail but the remaining will harvest the gains.
And right now if a perfect example. Growth is crushing value and people are starting to question whether or not it will work in the future. You need that doubt to creep in for any long-term approach to work over time.
Plus some passive gurus like Bogle, Malkiel, Ellis dissuade from factoring like value.
And it doesn’t matter how rational an investor is if a black swan emerges in his personal life like a tragedy.
This is true, life can always get in the way.
I have always had a problem with comparisons with historical data. How comparable is the market of 2015 with 1900, 1929 or even 1959? the size of the market in real terms in much bigger. the amount of information that is available to the average investor is much larger. The speed with which the information gets to the investor is much higher. The amount of disclosure require for public companies is much greater and the regulatory framework in which companies operate has changed. I know that Ben has raised these issue in the past but my basic question is can you compare the market in 2015 to the market in 1900, 1929 or even 1969? Oh yeah don’t forget about teh rise of the machines. investors no longer compete against flesh and blood. I am looking forward to the investor Thunder Dome
That’s fair. The structure and costs of operating in the markets are so different now. It’s tough to make cross country valuation comparisons in the present, but I think you’re right that making historical comparisons is even harder.
Yet confidence can built and cognitive biases relieved by reviewing results over many 10 year forward returns within a robust data sample. This using a simple stock / bond / cash switching strategy during occurrences when CAPE ratios were on the “high side”. https://docs.google.com/presentation/d/1mdon_cto48rvs2_lKWyMWrfqSIh8K0phfe7tThle8qQ/edit?usp=sharing
From the underlying link at greenbackd.com: “All the [CAPE-based] strategies underperform the simple buy-and-hold strategy over the full period.”
The 10-month SMA strategy presented in the Google link worked fine. But the CAPE was not an input to the decision rule.
Here’s a recent piece that tries to use valuation as a timing tool:
http://blog.alphaarchitect.com/2015/07/21/eureka-a-valuation-based-asset-allocation-strategy-that-might-work/
Everything I’ve looked at says valuation doesn’t work too well for this kind of thing.
Thanks. I had seen some of the earlier gestaltu work. Alpha Architect’s test shows some meaningful reduction in worst drawdown. But improvement in CAGR is marginal versus buy and hold.
After testing some CAPE-based models, I gave up the effort. Cheap markets can get cheaper; overvalued markets can get more overvalued. Ask Dr. Hussman, who’s been “hard negative” for a couple of years on a market that just won’t cooperate.
[…] a original article on A Wealth of Common Sense. Go to A Wealth of Common Sense to review some-more of Ben’s […]
[…] John Bogle to the growing list of respected investors — GMO, Research Affiliates, William Bernstein, Ray Dalio, Robert Shiller, Cliff Asness — who […]