“Be very careful using the past to understand the future. Past multiples are only relevant to the degree to which the underlying drivers of value are consistent through time. In fact, many of these drivers have changed, greatly diminishing the utility of past averages.” – Michael Mauboussin
In keeping with my recent theme about the importance of becoming a financial historian and learning to think about the cyclical nature of the markets, I thought it would be interesting to go way back to view the different long-term environments investors have had to deal with in past decades.
You can’t just blindly follow any single market or economic indicator and assume the future will follow the same path.
Yet knowing what has happened in the past can prepare you for future periods of over and underperformance in stocks and bonds.
The following table shows the average dividend yield, company earnings growth and performance of the S&P 500 by decade along with economic growth, inflation, average interest rates and the 10 year treasury returns (click to enlarge):
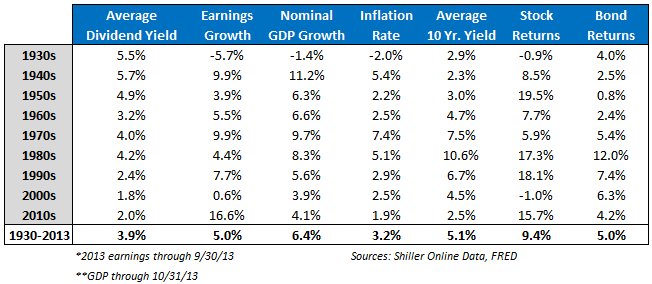
Some observations on this data:
- Add up the average dividend yield and the average earnings growth (8.9%) and you get pretty close to the long-term average annual stock return (9.4%) since 1930.
- Yet stock returns can be feast or famine depending on the decade.
- Dividend yields have come down in recent decades, but much of this stems from a combination of rising markets and share repurchases.
- Rising interest rates don’t necessarily have to be bad for stock returns (50s & 60s)
- There were times when bonds outperformed stocks (30s, 00s).
- There were long periods of negative real bond returns (40s to 70s).
- Bonds didn’t have a single decade of negative nominal returns proving their worth as a stabilizer for the low risk part of your portfolio.
- There were times of subdued inflation (50s-60s & 90s-present) and high inflation (40s, 70s & 80s).
- Stocks lost out to inflation over two different decades (70s & 00s)
- There were times when economic growth outpaced growth in company earnings (30s to 60s, 80s & 00s).
- There were times when company earnings growth outpaced economic growth (70s, 90s, 10s).
- Economic growth was fairly stable from the 1950s to the present time but stock returns were not.
- Stocks lost investors money during two decade long stretches (30s & 00s).
- Companies still paid decent dividends during those periods.
- The 1930s were a pretty terrible decade.
While we’re here, we might as well update the really long-term return numbers.
Professors Aswath Damodaran and Robert Shiller are kind enough to provide tons of really great long-term data on their respective websites and I find myself using both quite often.
Here are the annual returns from 1928-2013 for stocks (S&P 500), bonds (10 year treasuries), cash (t-bills) and housing (Case-Shiller through Q3):
- Stocks – 9.55%
- Bonds – 4.93%
- Cash – 3.53%
- Housing – 3.81%
Annualized inflation during this time frame was 3.07%. Subtracting inflation gives us the following real (after-inflation) returns:
- Stocks – 6.48%
- Bonds – 1.86%
- Cash – 0.46%
- Housing – 0.74%
I always find it helpful to see these numbers since the long-term view can get lost in the day-to-day noise.
Obviously, these figures constitute the really long-term and they don’t predict future cycles, but they do provide a nice perspective for those willing to keep their head down with an optimistic view of the future.
Sources:
Robert Shiller Online Data
Answath Damodaran


[…] Market cycles and why “you can’t just blindly follow any single market or economic indicator and assume the future will follow the same path.” (WealthofCommonSense) […]
Nice post, Ben. It’s funny, I did a very similar post on my blog few weeks back – slightly different presentation and metrics but exact same premise. I guess great minds think alike 🙂 I enjoy following your blog, keep up the good work…
http://planbynumbers.wordpress.com/2014/01/29/economy-in-perspective/
Thanks for sharing. I like how you put the unemployment rate in your piece (along with the deficit data). It’s an interesting one because stocks to better when unemployment is higher. Looking back at these really long-term numbers is always helpful in my book.
[…] The Way Way Back of Market Cycles (A Wealth of Common Sense) […]
[…] or GDP, or a range of other numbers. None of them are accurate, except over the very long term. Consider this excellent post. It compares all these and other data points to stock returns over different periods. Then, it […]
[…] long-term data shows that stocks are your best bet at beating inflation over a multiple decade time horizon. Yet […]
[…] depending on the current economic or investment cycle. And no two cycles are ever the same (see here) which keeps things […]