Halfway through the year, the S&P 500 was up 15.3%, including dividends.
Despite these impressive gains the bull market has been relatively boring this year.
There have been just 14 trading days with gains of 1% or more. There has been just a single 2% up day in 2024. And there have only been 7 days of down 1% or worse.
Small moves in both directions.
Bull markets are typically boring like this. Uptrends tend to be these slow, methodical moves higher. Bull markets don’t make for good headlines because they’re made up of gradual improvements.
Bear markets, on the other hand, are where the excitement happens. Downtrends are full of both big down days and big up days.
The bear market of 2022 is a good example. During that awful year in the stock market, the S&P 500 was down 1% or worse on 63 trading days. There were also 23 down days of 2% or worse and 8 separate 3% daily losses.
But there were tons of big up days as well — 59 days of +1% or more, 23 days of 2% or more and 4 days of 3% or better.
The best and worst days happen at the same time because volatility clusters. Volatility clusters because investors overreact to the upside and the downside when emotions are high.
This is why the stats that show your returns if you just missed the best 10 days or whatever are pointless.
The second-best day of 2020 (+9.3%) was sandwiched between the two worst days (-9.5% and -12.0%) during the Covid crash. The best day of 2020 (+9.4%) followed daily losses of -4.3% and -2.9%.
Markets aren’t always like this but these are the general characteristics of uptrends and downtrends.
So why should you concern yourself with the characteristics of uptrends and downtrends as a long-term investor?
It can be helpful to be aware of your surroundings when investing so you aren’t one of those people who overreact when fear or greed are running hot.
It’s also interesting to note that even though the S&P 500 is having a boring year, it doesn’t mean every stock in the index is having a similar experience.
While the S&P is up more than 15% there are 134 stocks down 5% or worse while 85 stocks are down 10% or more so far this year.
Stock market returns are concentrated in the big names this year, but it’s normal for many stocks to go down in a given year.
JP Morgan has a cool chart that shows the number of stocks in the S&P 500 that end the year down 5% or more going back to 1994:
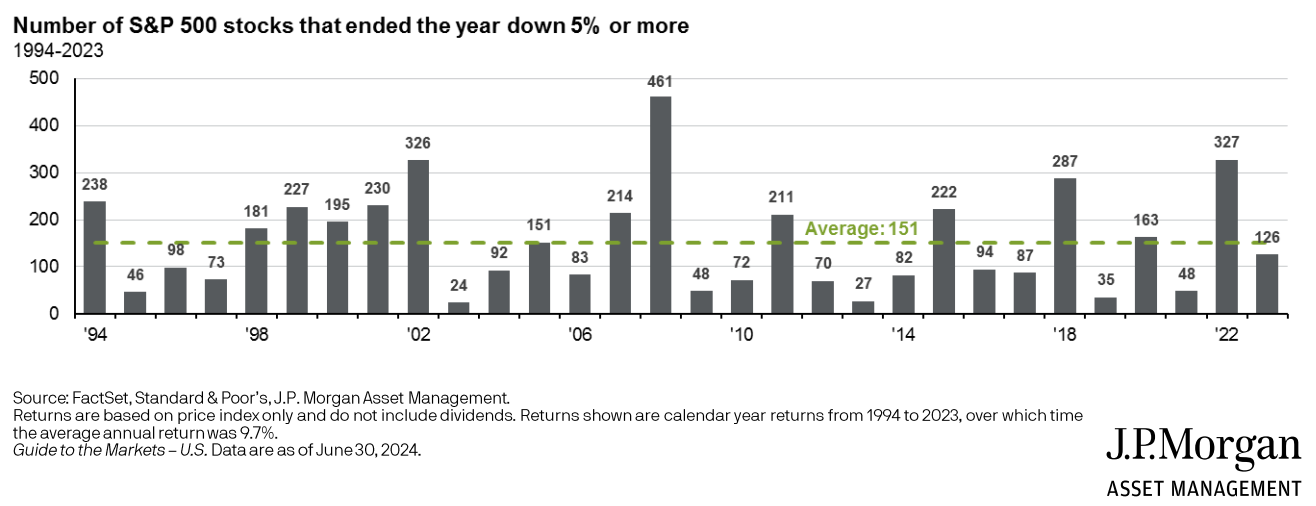
It makes sense that you’d see high numbers in the bad years (2000-2002, 2008, 2018, 2022, etc.), but plenty of stocks also went down during the up years.
Just last year, nearly 130 stocks were down 5% or more when the index was up more than 26%.
They say successful investing should be like watching paint dry.
Just remember that markets won’t be boring forever.
At some point the excitement and volatility will return.
Further Reading:
The Long-Term is Not Where Life is Lived
