“The easy money has been made” is one of my least favorite sayings in all of finance because you can only know this with the benefit of hindsight. Well, with that benefit, 2017 was about as easy as it gets. There hasn’t been a down month or a loss of greater than 3% in the S&P 500 all year. Volatility has been non-existent to both the upside or the downside. In this piece I wrote for Bloomberg, I look into some more stats on just how easy it’s been as well as a reminder that it won’t last forever.
*******
With a 2 percent gain in September, the S&P 500 Index has set a record: positive returns (1) in each of the first 10 months of the year. There’s never been a full calendar year when this has happened every month.
Going back to November 2016, the index has ripped off 12 consecutive monthly gains. The S&P hasn’t had a down quarter since the third quarter of 2015, a streak of eight in a row without a loss. Since the start of 2013, 18 of the past 19 quarters have been positive. And it’s not like stocks are melting up either. They are going up slowly as volatility is slowly going down.
Not only have stocks been consistently profitable recently, but they have done so with remarkably low volatility. This year, there has yet to be a 2 percent move up or down on the S&P 500. For a frame of reference, in 2009, there were 55 separate 2 percent up or down days and there were 35 in 2011. The annualized volatility of daily returns on stocks since 1928 has been 18.7 percent. For 2017, that number is 7 percent, a little more than one-third of the long-term average.
The average absolute daily price change (2) this year on the S&P 500 is just 31 basis points. If the year ended right now, that would be the lowest daily price change on record since 1965. The worst peak-to-trough drawdown is just 2.8 percent this year. Over the past 100 years, the average intrayear drawdown in stocks has been around 16 percent. The shallowest calendar-year peak-to-trough drawdown was in 1995, when the worst loss in stocks was just 3.3 percent for the year.
So investors in U.S. stocks have had double-digit gains three-quarters of the way through the year, with increases every month, nonexistent volatility, and nothing even approaching a 5 percent correction. It’s looking like a record-breaking year in terms of a calm market. As far as investing in stocks goes, this year has been about as good as it gets — so far.
It’s worth remembering that stocks are cyclical, even if those cycles don’t run on set schedules. The following shows the historical drawdown profile of the S&P 500 going back to just before the Great Depression:
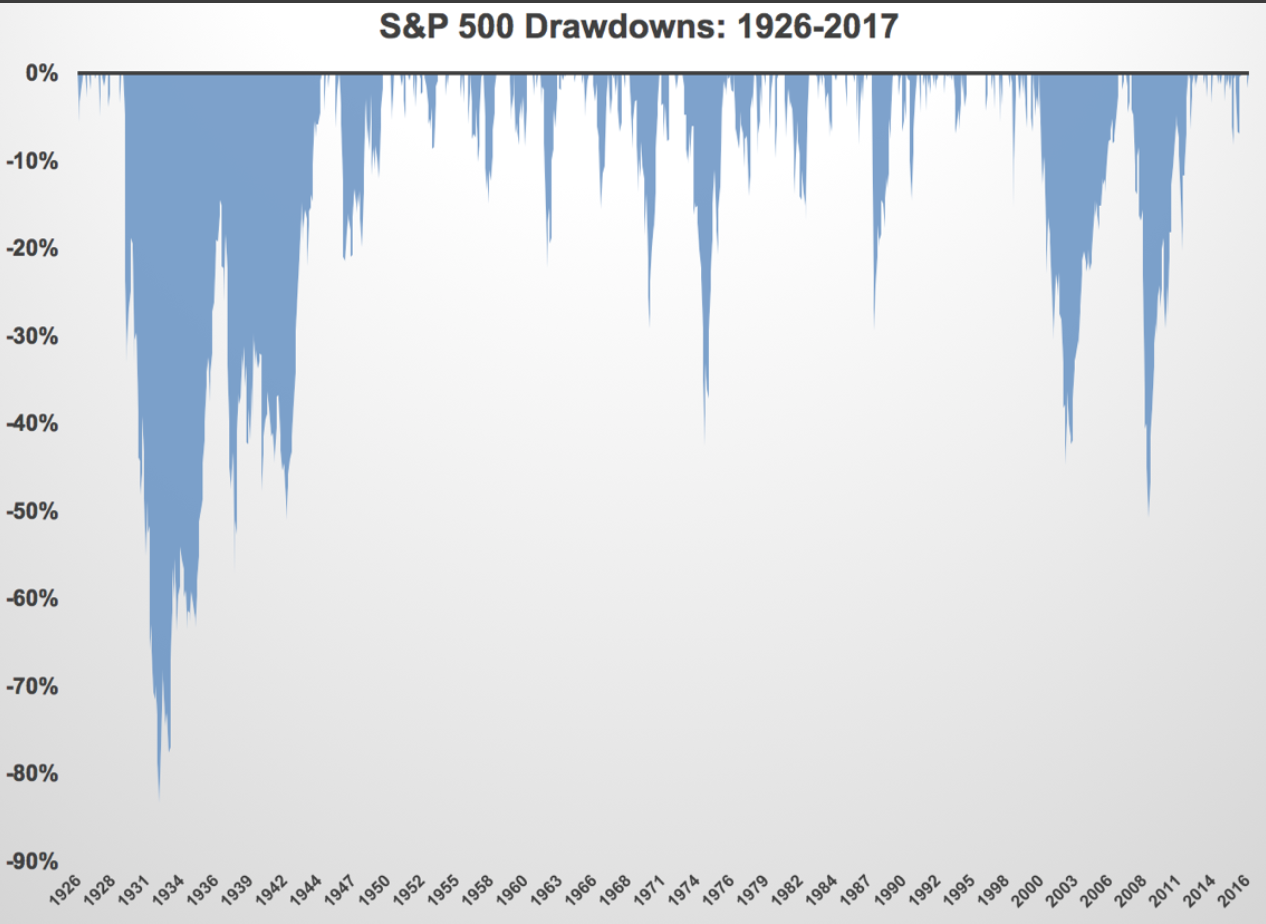
Your eyes are likely immediately drawn to the enormous losses seen in the 1930s, 1970s and back-to-back crashes of the 2000s. But these are fairly rare events. Since 1980, the S&P 500 has had 13 double-digit declines with an average loss of 24 percent. Nine of those 13 corrections were declines of less than 20 percent (3). That would amount to a double-digit drawdown every three years or so. Taking the data back to 1928 would give stocks a double-digit loss every two years, with an average decline of 24.3 percent. The longest drought occurred in the 1990s, when stocks went almost 8 years without a double-digit loss from 1990 to 1998.
I’m fairly certain that stocks are going to crash at some point in the future. I don’t know when that will be or how much higher they will be from current levels, but it will happen. Stocks have to crash intermittently to function properly over the long term and offer a premium over fixed-income assets.
Even when things are going great, as they are now, there are risks involved. Investors could become too complacent, which can cause them to take more risk than they should. Eventually, stability can cause instability when investor preferences for risk become greater than they realistically should be.
And when the inevitable correction or crash does hit, certain investors will panic, bail out at the wrong time and lose money. The losers in a bear market tend to be those who have no plan of attack going into it, with little understanding of their willingness, need and ability to take on risk.
So, calm markets could last for a while longer, but they won’t last forever.
(1) Including dividends. The month of March saw a slight decline in the price index but with dividends included was up 0.12 percent.
(2) Absolute meaning no negative numbers, just the distance from zero.
(3) Although three of them were really close to the standard definition of a bear market. In 1990, 1998, and 2011 stocks fell 19.9 percent, 19.3 percent and 19.4 percent, respectively.
Originally published on Bloomberg View in 2017. Reprinted with permission. The opinions expressed are those of the author.
