Through the end of the day Monday, emerging market stocks (as proxied by VWO) are up 28% in 2017 compared to a 17% gain in U.S. stocks (SPY). While U.S. stocks have been up for 8 years in a row, emerging markets have fallen 4 of the past 8 years. All stock markets are cyclical but EM stocks may be even more so than most. This piece I wrote for Bloomberg provides some context on this cyclicality. EM is not a place everyone is comfortable investing but for those who are, you need to understand what you’re getting yourself into.
*******
Emerging-market stocks are quietly having a huge year. Through mid-September the iShares MSCI Emerging Markets ETF, known as EEM, is up more than 31 percent, outpacing gains in both U.S. and foreign developed markets, which are up 13 percent and 19 percent, respectively.
If you’ve been a long-term holder in emerging markets, this year’s gains have felt like they were a long time coming. Total returns in EEM from 2008 to 2016 were minus 16 percent. In that same time, the S&P 500 was up almost 85 percent. Before rallying double digits in 2016, emerging-market stocks were in negative territory in four out of five years beginning in 2011.
Looking a little further back, you can see the MSCI Emerging Markets Index is currently in a lost decade in terms of price performance:
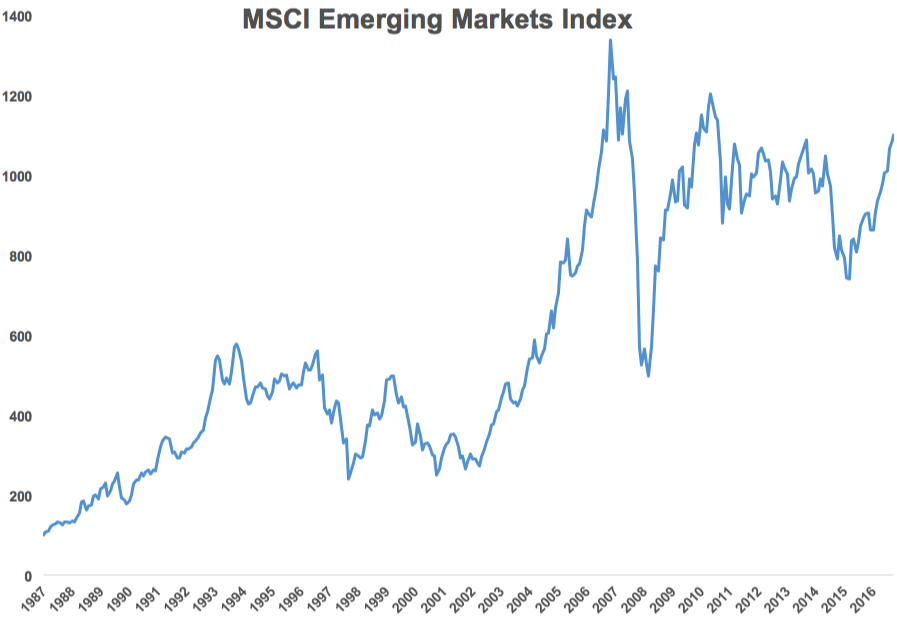
The index still is about 17 percent below its peak in the fall of 2007. Emerging markets remain an attractive asset class because of their relatively higher growth prospects compared with developed markets, but investors have to understand how things generally work in developing countries before investing.
Here are some tips to better understand this market:
Emerging markets are highly volatile. Going back to the inception of the MSCI EM Index in 1988, 76 percent of all annual calendar returns have been double-digit gains or losses. Also, almost half of all annual returns in that time were either gains or losses in excess of 20 percent. In that same period, the volatility of emerging-market stocks has been double that of their U.S. counterparts. Investing in emerging markets requires sitting through bone-crushing volatility most of the time, with higher highs and lower lows than more mature markets.
Even 10 years isn’t long-term in the stock market. Stocks generally become less risky the further you lengthen your time horizon as an investor, but even 10 years isn’t enough time to completely wipe out risk. The U.S. has experienced its own lost decades in the past, most recently from 2000 through 2009, when the S&P 500 lost 9 percent in total. Emerging markets experienced another lost decade from 1994 through 2003, when the MSCI EM Index was up just 1 percent over that 10-year stretch. Long-term in stocks is far longer than most investors assume.
Diversification matters. When the S&P had its lost decade, from 2000 through 2009, emerging-market stocks were up more than 160 percent. When EM had its lost decade, from 1994 through 2003, the S&P was up almost 185 percent. From 1988 through 2016, the returns in emerging market and U.S. stocks were almost identical, as both gave investors gains of slightly more than 10 percent per year. But if you were to construct a portfolio consisting of 80 percent in U.S. stocks and 20 percent in EM, rebalanced annually, the combined return was higher than both of the individual markets, coming in at closer to 11 percent annually.
The reason for this is that these markets show relative cyclicality with one another. This table shows how stark these cycles can be:
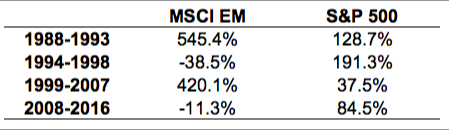
Using two volatile assets that both earn similar long-term returns, but take a much different path to get them, can add value to a portfolio, assuming you have the patience and discipline to stick with it when one of them is not working.
Picking the best emerging-market countries to invest in is not easy. Emerging markets are made up of vastly different countries. This has caused some to question whether they should even be considered an asset class in the first place. The problem is that the winners vary from year-to-year by such a dramatic amount that it’s very difficult to pick the winners. This table from Dimensional Fund Advisors shows the ranks of the annual performance by country over the past 20 years:
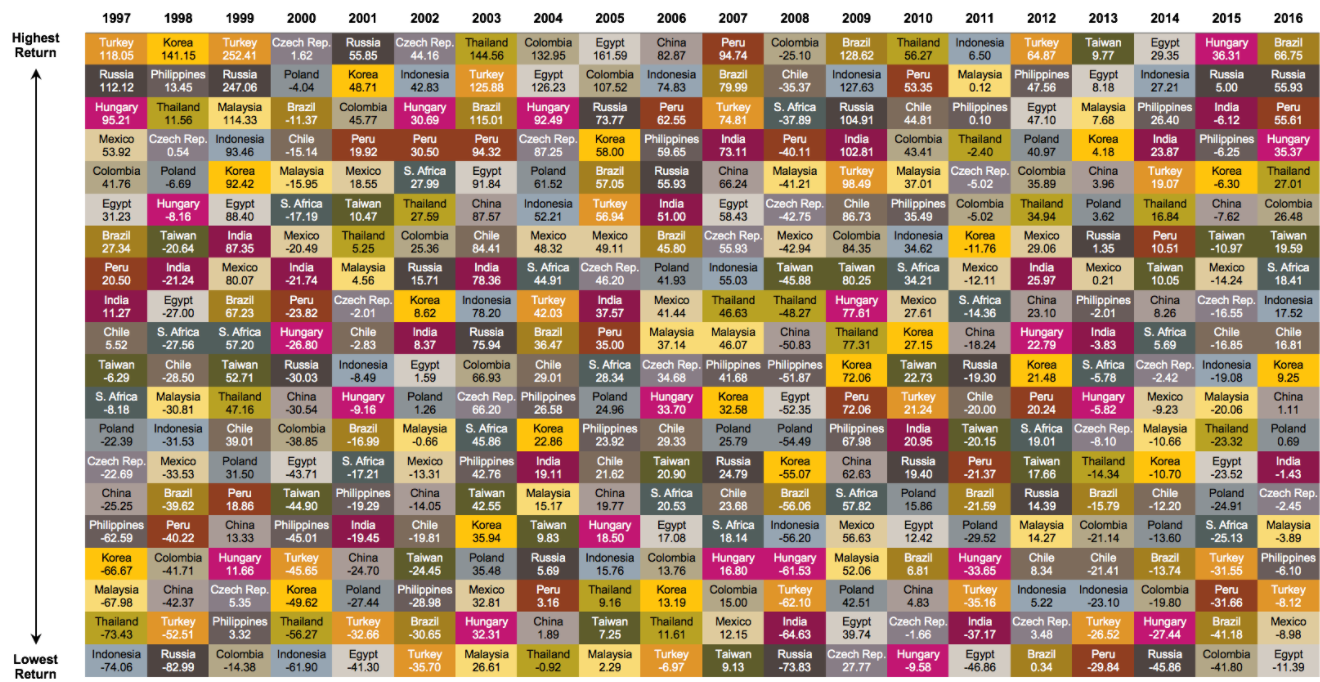
The average annual performance of the cellar dwellers was minus 26 percent, while the average annual performance of the top performers was plus 81 percent. That means the difference between the best- and worst-performing countries was more than 100 percent each year, on average. There’s no rhyme or reason to the order of these countries. So if you plan on placing a more concentrated bet on certain countries or regions you need even more intestinal fortitude than you would investing in a broad basket of emerging-market stocks, because the volatility is even higher in the individual countries.
U.S. stocks have had a great run since the financial crisis ended in 2009. Emerging markets have badly lagged in that time. One year does not make for a trend, but valuations and performance momentum could put more attention on developing-market stocks and attract flows to the sector. If that were to happen, there’s a good chance we’re at the beginning of a turning point in the cycle that could see emerging-market stocks outperform U.S. shares for years to come.
Originally published on Bloomberg View in 2017. Reprinted with permission. The opinions expressed are those of the author.
