A friend recently asked for some advice about his investment portfolio. He told me he’s considering a strategy that would involve dollar cost averaging into leveraged ETFs such as the ProShares Ultra S&P 500 3x Leveraged ETF (UPRO).
He told me that he understands the increased volatility, the potential for greater drawdowns and possible decay from the daily resetting of leverage on these vehicles but wanted to know if there is anything else he’s missing when considering this idea.
I have to be honest that I have never really done a deep dive on this particular fund because the majority of leveraged ETFs are meant for trading, not investing.
The idea behind UPRO is that $1 invested will theoretically give you $3 of exposure to the S&P 500. The one thing to remember on these funds is that the leverage is reset on a daily basis so everyday investors in the fund can buy in at the 3x leverage (meaning you are promised more or less 3x exposure for a single day’s returns).
One risk behind this strategy is that this daily reset could cause decay. An example might help.
If you invest $100 into the 3x leveraged ETF and the index is up 5% the ETF would be up 15% and go to $115. If the index then loses 5% the next day your 15% loss would drop the market value to $97.75. An investment in the simple index would be worth $99.75 in this scenario ($100 to $105 to $99.75) meaning your loss of -2.25% in the 3X leverage is much higher than the index loss of -0.25%.
So even in a market that doesn’t really go anywhere but is highly volatile, this type of strategy will be painful. Volatility acts as a tax on returns in these products.
On the other hand, in market environments where the underlying asset is in a low-volatile uptrend, the opposite is true.
Take a look at the annual returns for UPRO and the S&P 500 ETF (SPY) since this product was launched in the summer of 2009:
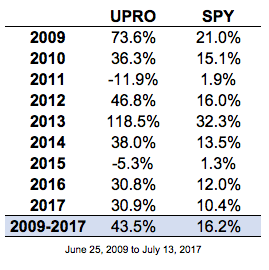
Better to be lucky than good, but the timing by ProShares on the launch of this product was extremely fortuitous. This has been one of lowest periods of market volatility on record and this ETF has reaped the benefits. By my estimation, that’s close to a 1400% total return on UPRO to only a 200% total return on SPY.
So why doesn’t everyone simply invest in the leveraged version of their favorite stock index?
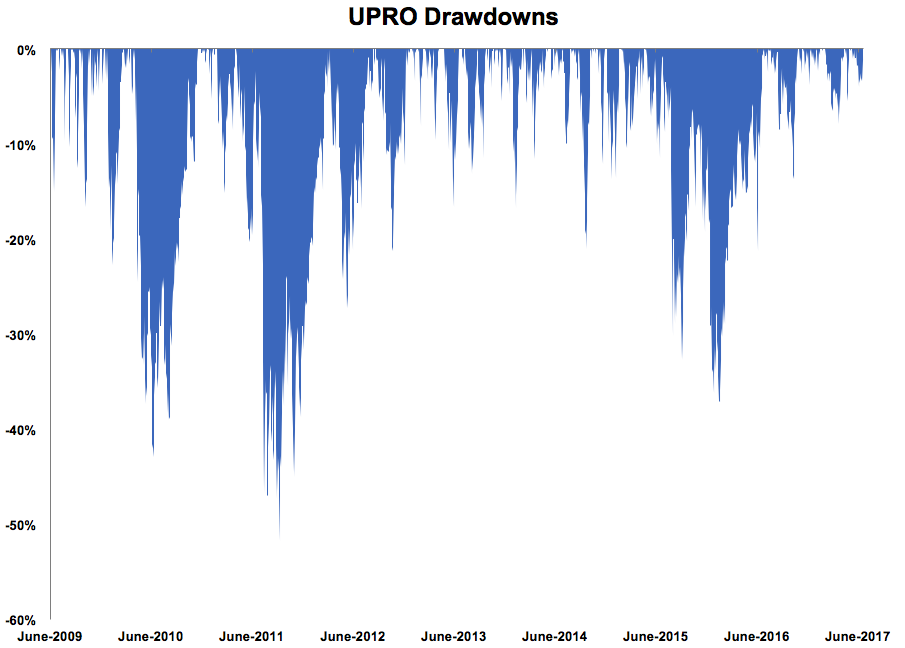
While this has been a fairly calm market in recent years there have been corrections since 2009, most notably in 2010, 2011 and early-2016. Take a look at the drawdown profile for UPRO since inception:
Now take a look at the drawdown profile for SPY (on the same scale):
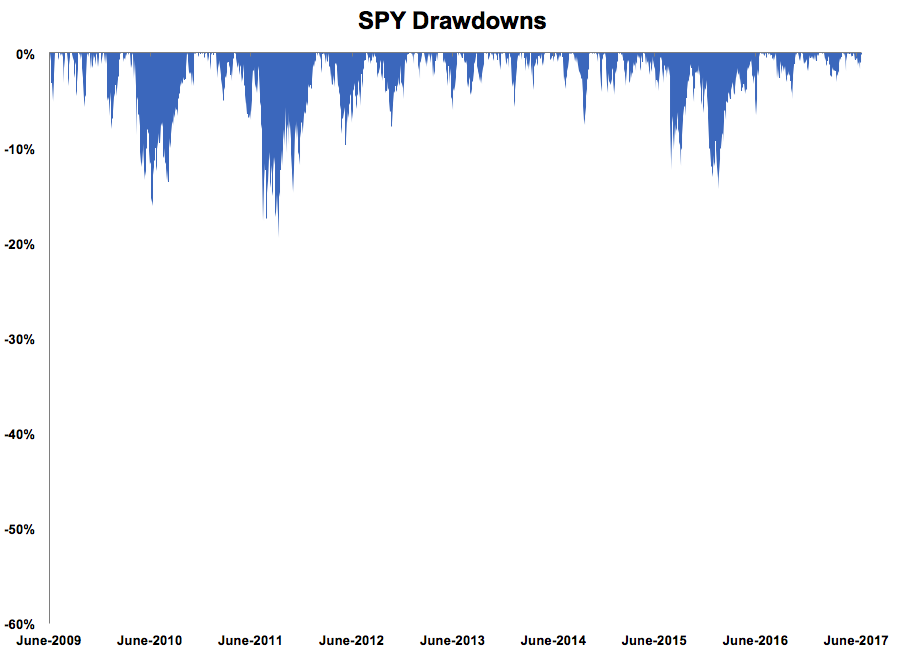
In a very strong bull market, UPRO has basically been chopped in half on three separate occasions. Just eyeballing the UPRO chart I see 10 bear markets or so in the past 8 years. And these huge drawdowns occurred in a relatively calm market environment. Can you imagine what the losses will be when we see a real bear market?
My guess is the losses will be on the order of 70-75% in a normal bear market with losses in the 90-95% range in a 2008-type scenario. To recover from a 95% loss would require a gain of 1900% simply to break even. A 90% drawdown requires a 900% return to be made whole again.
As my friend and colleague Michael Batnick likes to say, “bad things happen in bad markets.” This means that volatility is typically heightened during a sell-off when investors panic, as they are prone to do. So you would be getting a double whammy of a larger drawdown in combination with decay from highly volatile markets when we do experience the next bear.
So while this type of ETF is not as much of a daily trading vehicle as some other leveraged ETFs out there, your outcomes will rely heavily on the type of market environment we’re in.
Should the current low volatility uptrend in the markets continue, UPRO will likely continue to deliver outsized returns to investors. But should volatility return, as it does on occasion, this thing could get ugly.
Further Reading:
The Worst ETFs You Can Own
