“The essence of investment management is the management of risks, not the management of returns.” -Benjamin Graham
Investors spend a lot of time trying to figure out what returns the markets will give them in the future. It feels like a weekly occurrence that I see another fund firm or well-known investor trot out their forecasts for future market performance.
People have been predicting lower future returns for a number of years now (the opposite has happened) so this is obviously easier said than done. I’m sure these people will be right eventually, but there are simply far too many variables to precisely predict future stock market returns.
The variable investors don’t spend enough time on is the one that’s much easier to predict — risk.
For example, people have been citing Robert Shiller’s cyclically adjusted price to earnings (CAPE) ratio since probably early-2010 or so to show how overvalued the stock market is. And you can see from the data that this would seem like a sound prediction.
Here I used Shiller’s data going back to 1926 to show the average three, five and ten year returns on the S&P 500 from different CAPE ratio ranges as the starting point:
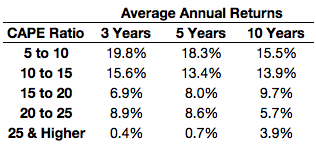
There is a clear relationship between starting valuations and average future stock market performance. It looks obvious from this data that returns should be far lower from current CAPE levels (around 28) based on market history.
The problem is that averages typically lie to investors because they hide the risk — both to the upside and the downside. Here are those same starting CAPE valuations but now shown as ranges of best and worst three, five and ten year returns:
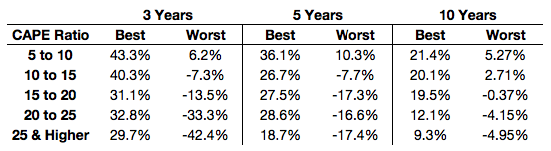
The same relationship applies as higher valuations have tended to lead to lower returns, but now you can get a sense of how far off actual can be from average. The spread between the best and worst returns has been huge over time. Trying to forecast future returns using this data with any precision is nearly impossible. On average this game looks easy, but in practice there is far too much upside and downside risk to account when making return predictions.
What you can use these valuation numbers for is to set realistic expectations. While there have been outlier returns from both high and low starting CAPE ratios, there is still a trend that exists within these numbers that should temper your expectations from current levels. You can see much higher highs and lows from lower starting valuations and lower highs and lows from higher starting valuations.
You can still get pretty good returns from high valuations starting points or poor returns from relatively low valuations, but the floors and ceilings are definitely different depending on the CAPE ratio range.
With a starting CAPE ratio of under 20 there was only a single ten year period that ended with negative returns (and just barely). There were no ten year periods that ended with negative returns from a starting CAPE of 15 or lower. However, almost 10% of all ten year periods with a starting CAPE of 20 to 25 saw negative 10 year returns while nearly 28% of periods were negative with a starting CAPE of 25 or higher.
(It’s also worth noting that a CAPE of below 10 or above 25 have only been seen roughly 25% of the time — split pretty evenly between the two — so both very high and very low valuations don’t have as large of a sample size to measure from.)
The probabilities are still in your favor as a long-term investors in these cases, but the potential for risk has been greater from higher valuation levels, which is where we currently stand. You should always plan for a wide range of outcomes in the markets, but this data can be useful as a way to better define those ranges (with the caveat that these ranges are by no means set in stone).
I also wanted to see how starting valuations would affect market volatility using these same numbers and was surprised with the results:
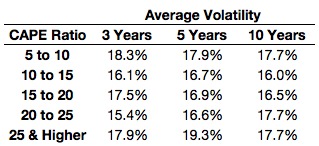
I actually expected this one to come out a little differently. I was expecting much higher volatility at higher valuations but that hasn’t necessarily been the case. Volatility has been fairly similar across all valuation ranges historically.
While these numbers were somewhat surprising to me, maybe they shouldn’t be. Volatility is a constant in the markets, whether it occurs to the upside or the downside.
Volatility is not a form of risk per se, but it can be if it causes unforced investor errors.
I wish I could tell people the exact stock market returns they will see in the coming years. The best I can do is tell people it’s a good idea to lower their expectations from what we’ve seen since 2009.
My only real forecast is that risk will be far easier to predict than returns because risk is ever present in the markets while returns are promised to no one.
Further Reading:
CAPE Fear of Lower Returns
