The old joke is that the stock market has predicted 9 out of the last 5 recessions. Finance pros also contend that the bond market is much smarter than the stock market.
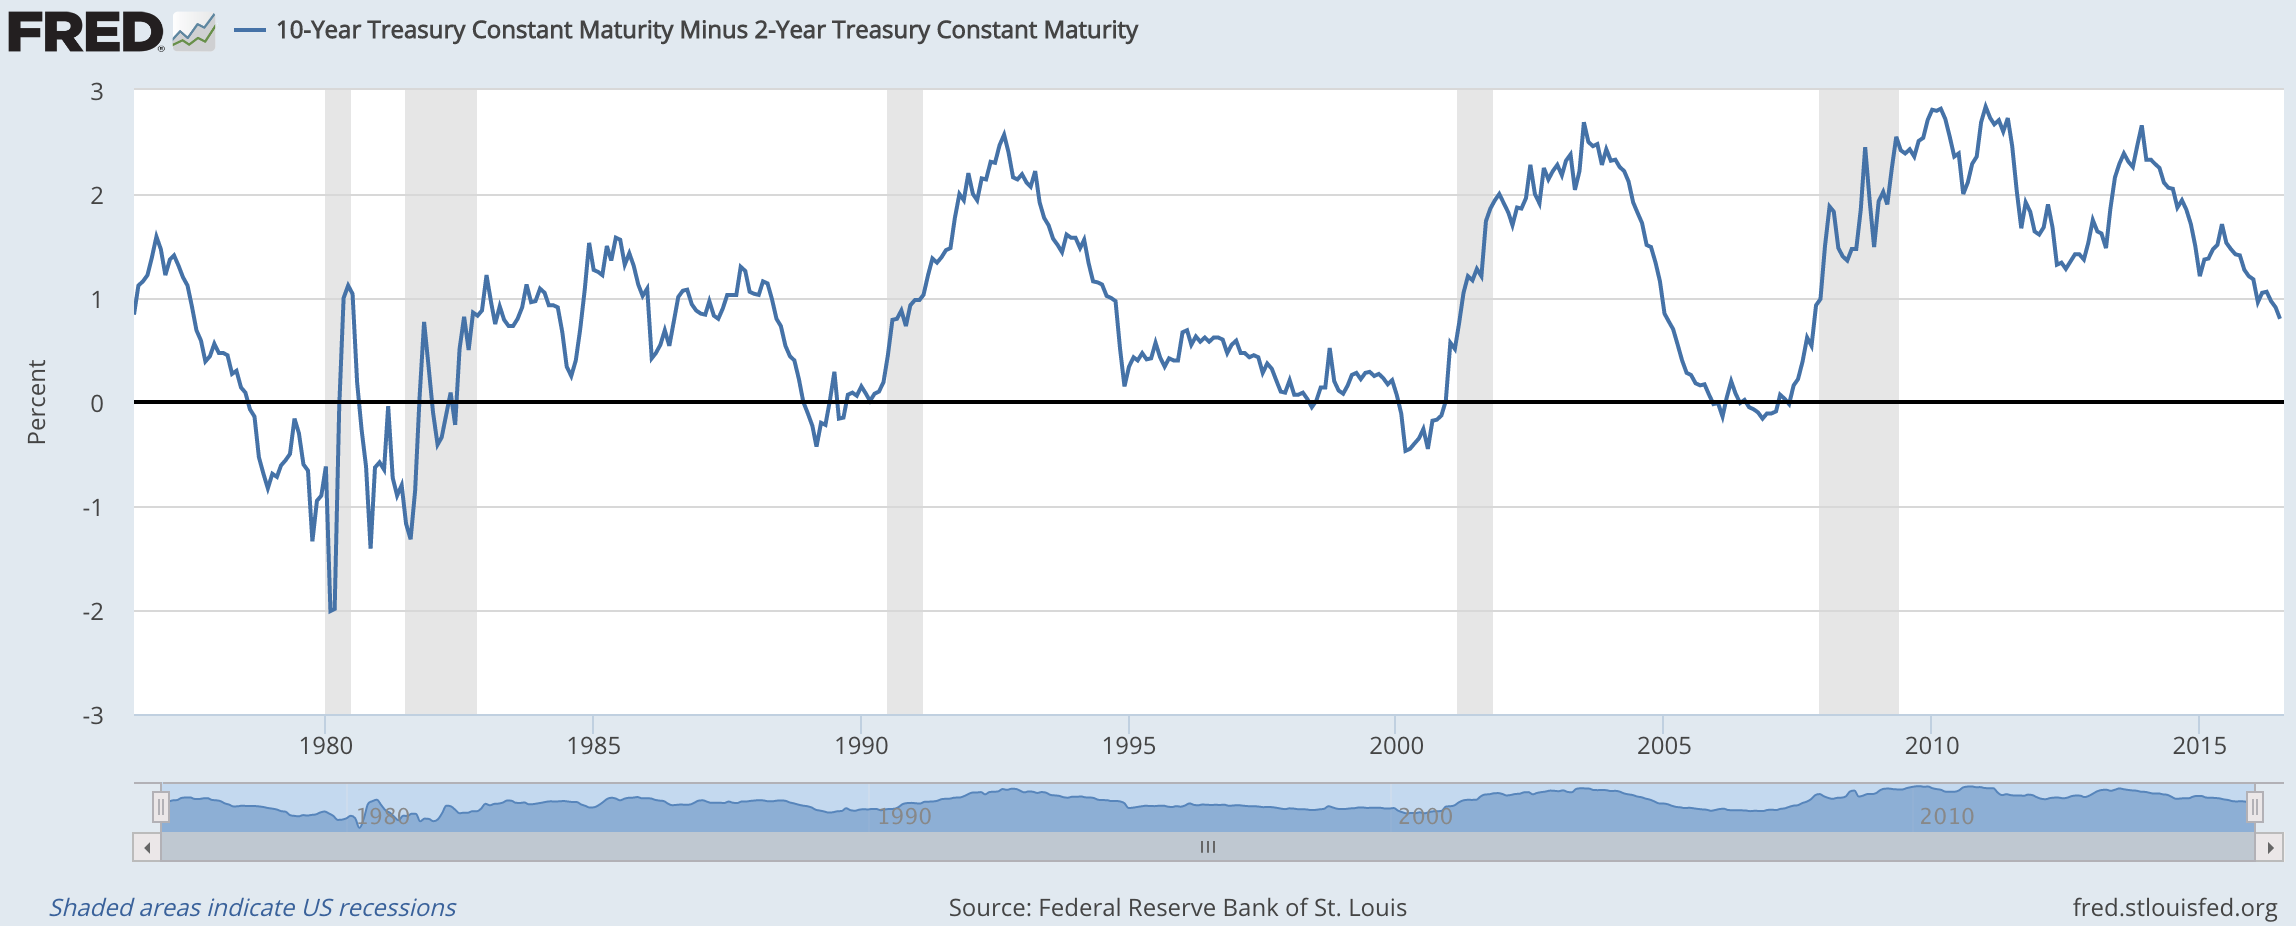
Case in point says the bond market elites is the shape of the yield curve. The indicator most industry observers pay close attention to in terms of bonds and recessions is the spread between 2 year treasury yields and 10 year treasury yields, which you can see here:

You can see that every single time that 10 year yields have fallen below 2 year yields it has preceded a recession (the shaded regions). This data only goes back to the late-1970s but is impressive nonetheless.
As with all market-related signals, you can’t blindly follow something simply because it’s worked well in the past. There has to a logical reason for it to work going forward, as well.
In this case there is a logical reason for using the yield curve as an economic signal. Bond yield spreads are typically used to gauge the health of the economy. Wider spreads between long-term and short-term bonds lead to an upward sloping yield curve, which can indicate healthy economic prospects — most likely higher growth and inflation in the future. Narrower spreads lead to a flatter or even negatively sloped yield curve, which can indicate poor economic prospects — most likely lower growth and inflation.
Treasuries are seen as a safe haven asset so when long-term yields are rising that’s usually because investors are selling long bonds in hopes of finding better investment opportunities elsewhere. When long-term yields are falling that’s an indication that investors are clamoring for safe assets in the event of future economic troubles or worries.
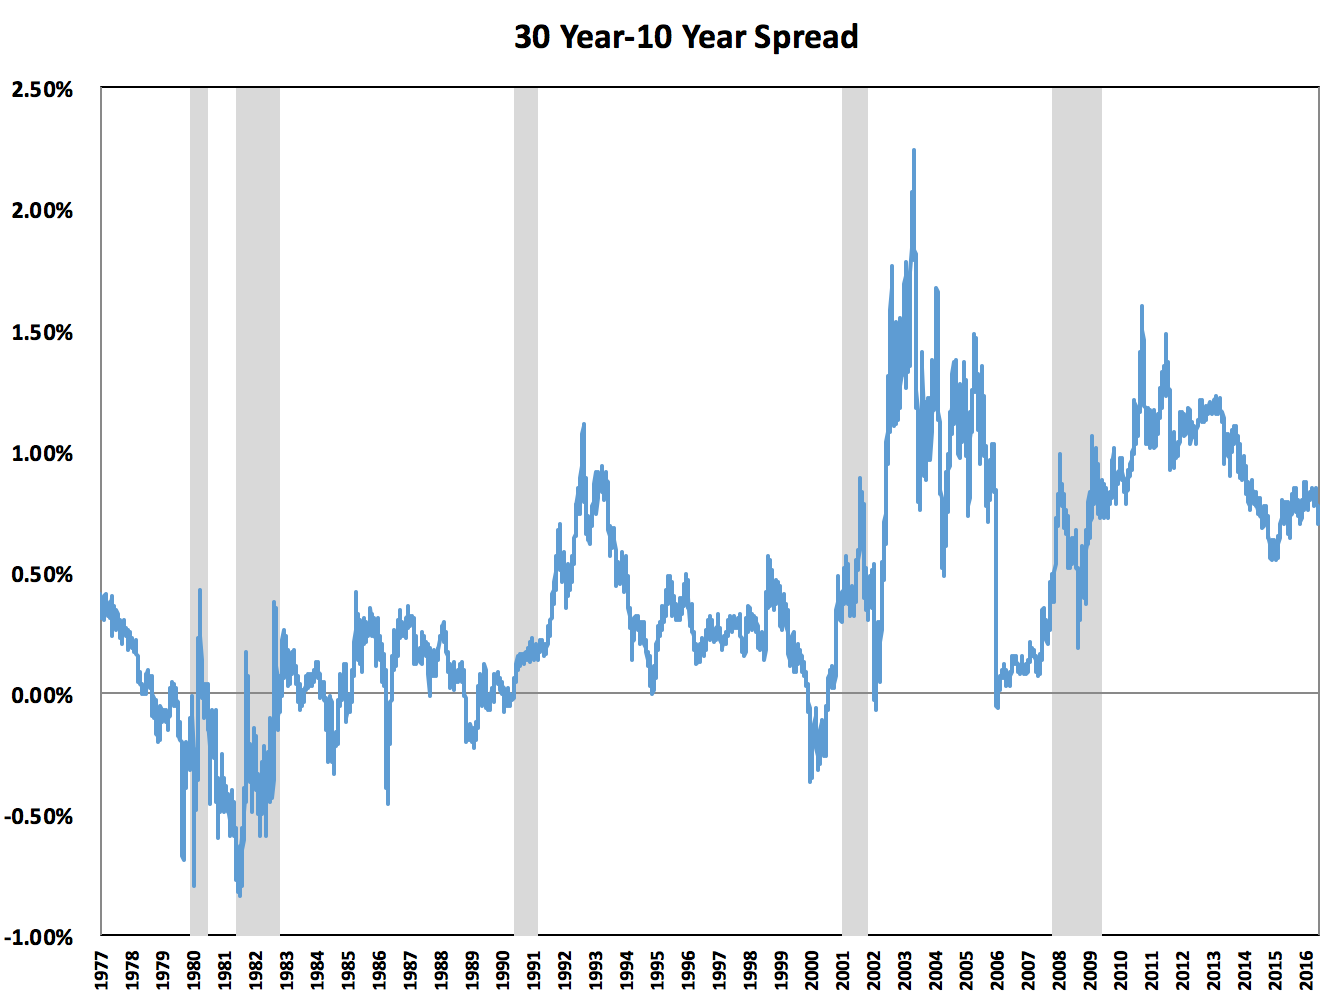
There’s nothing magical about the 2-10 spread so I decided to check out the historical spreads between 10 year yield and the 30 year yield:

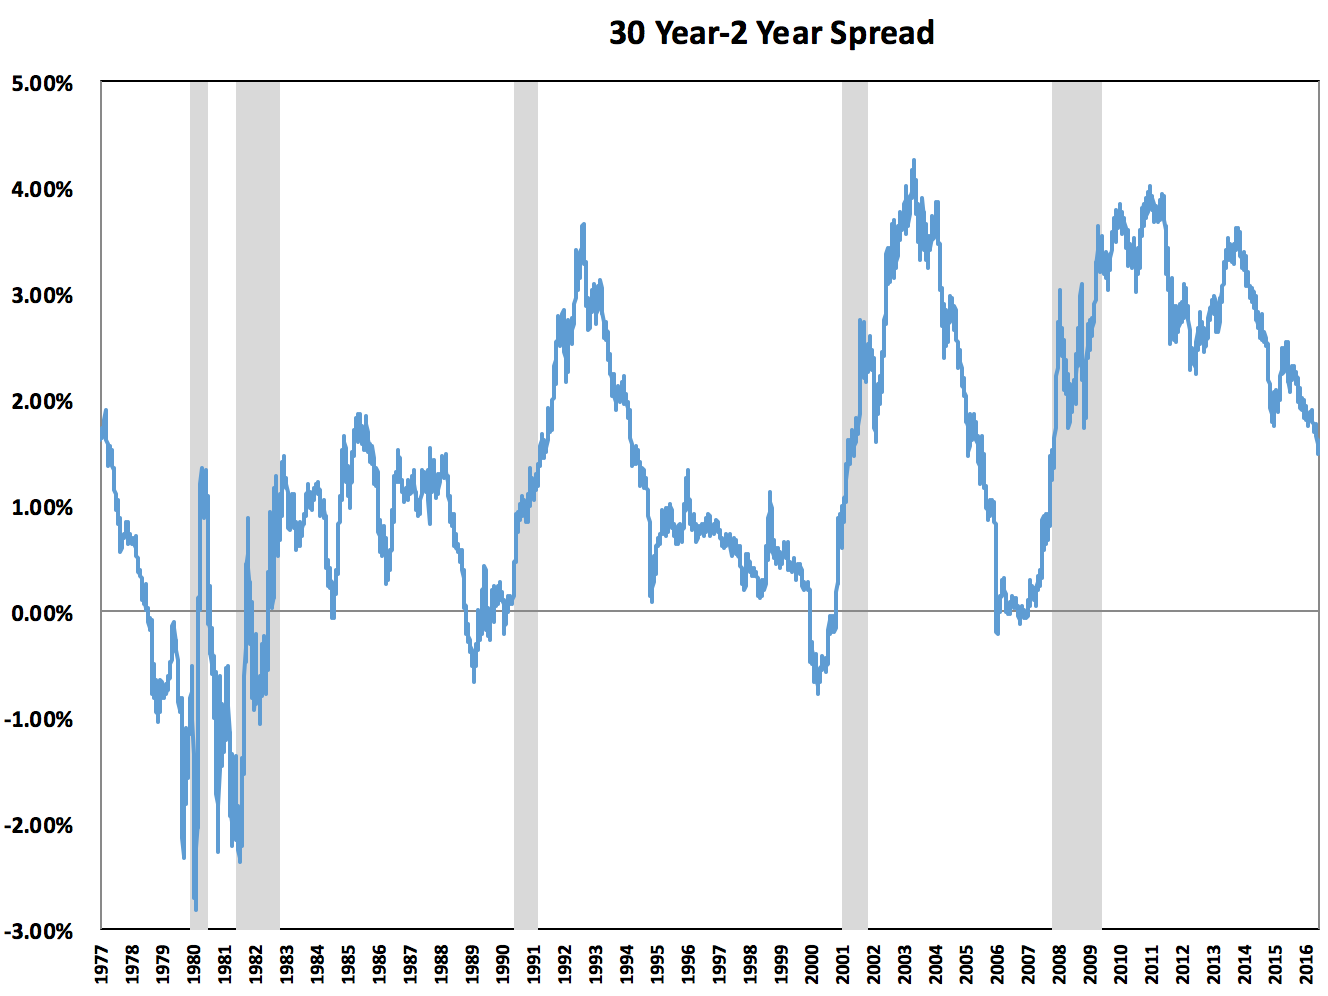
Technically this one is long yields against even longer yields so it would make sense that this one doesn’t work quite as well as a signal. Basically the entire 1980s period didn’t see much of a spread between these two rates. Now here’s the 30 year yield over the 2 year yield:

The 2-30 spread offers a similar look to the 2-10 spread, which makes sense as this is another good indication of long-term versus short-term rates.
It’s also worth noting that the 2-10 spread isn’t exactly in the danger zone just yet. The average spread over this roughly forty year window is 0.96%. The latest reading is around 0.80%. Even though the gap is going in the wrong direction on the graph it still has a lot of room to narrow and flatten out even further. If this economic recovery has taught us anything, it’s that these cycles don’t always follow a set script in terms of magnitude or speed.
I’m stating the obvious here, but economic environments are always different. This time around central banks and foreign investors around the globe are huge purchasers of treasuries. I think we’re in something of an anti-risk bubble. You have to take these factors into account when thinking about potential reasons for this move in rates.
But I also think it would be dangerous to completely ignore an inverted yield curve should we get to that point. Artificial or not, that doesn’t strike me as a good indication of risk appetites or economic prospects.
If and when it does happen there will likely be pundits and investors alike dismissing the potential meaning. The last time around I recall the experts proclaiming it wasn’t a big deal because the only reason the yield curve was inverting was because the Chinese were buying up all of our long-dated treasury bonds. It seems like there will always be a reason or excuse not to worry.
It’s possible that this time will be different. But this is something worth watching.
Further Reading:
When Will the U.S. Have its Next Recession?
