“Investment success accrues not so much to the brilliant as to the disciplined.” – William Bernstein
In January of 1966 the Dow Jones Industrial Average hit a level of 990. It would continue trading in a range of roughly 600 to 1,000 over the following 17 years. It once again reached 990 in December of 1982 before finally breaking out and heading higher.
The Dow never dropped below 1,000 again.
This long, drawn out sideways market is one of the ultimate devil’s advocate positions for those that like to argue against stocks being a solid long-term investment. Although this was technically a sideways market we need to put some context around this time frame.
First of all, the Dow isn’t the only way to gauge the stock market. It’s a price-weighted index consisting of only 30 blue chip stocks, but it’s mostly used for nostalgic purposes today. It has a really long historical track record so it still gets publicity.
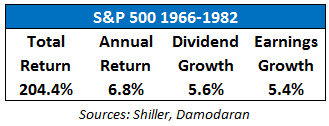
If we instead look at the S&P 500 from 1966 to 1982, things don’t look too bad from a nominal perspective:

The Dow went sideways, but the S&P actually earned a respectable 6.8% return in that time. Dividends and earnings also showed relatively healthy annual growth rates. The S&P 500 went from a price level of 92 to 140 so three-quarters of the performance came from dividend payments.
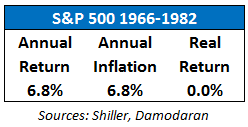
But those numbers don’t tell the entire story as inflation was out of control, especially in the late 70s and early 80s. Here’s why inflation was the real widow maker that caused this sideways environment in real terms:

One of the main aims of long-term investing is to beat inflation over time to increase your standard of living. The reason this was such a frustrating investing environment was that stocks only broke even after accounting for inflation while bonds lost nearly 40% in real terms.
So we went from stocks are still a decent investment in chart number one to stocks are a horrible investment in chart two. Let’s look at one more piece of data before putting it all together from a retirement savings perspective:

Runaway inflation is a scary issue to deal with. But you can see that wages were probably the main culprit as they grew much faster than both stocks and inflation.
The median family income was $6,900 in 1966. Assuming someone stocked away 15% of annual earnings that means in 1966 they would have been saving $1,035 per year.
With no changes to that percentage over time that means the amount saved would have compounded by 8.8% per year based on wage growth. So by 1982, the amount saved jumped to nearly $4,000 a year (almost $10,000 in today’s dollars).
Increasing the savings rate by just 20% of each annual raise (so keeping the remaining 80% for spending purposes) and that 15% increased to 20% of income by 1982 (or almost $6,000 in 1982 terms and $15,000 in today’s dollars).
That’s where investors made up ground from the underwhelming performance in stocks. Remember, the stock market is simply a place to park your savings over time. Most likely, the amount you save will have a far greater impact on your ending portfolio balance than a few extra basis points of investment performance
It’s interesting to note that the 1966-82 period of low stock returns, high inflation, and high wage growth is basically the exact opposite of the current environment of high stock returns, low inflation and stagnating wages.
You’ll notice that out of these three the one you have the most control over is how much you save.
Many smart people in the industry are predicting lower investment returns over the next decade or so. Who knows what will happen, but it makes sense to prepare for that possibility.
One of the most interesting scenarios over the next few years would be if the economic recovery really takes off, the job market improves and wage increases ultimately cause lower stock market returns. In that situation everybody is confused and many investors are left extremely frustrated.
We’ll never see another environment exactly like the 1966-1982 period, but we will definitely see periods of underwhelming market performance. A successful investment plan includes preparing yourself for a number of different scenarios so you don’t overreact when things don’t go as planned.
As always, long-term performance is mostly about your reactions, not necessarily your actions.

[…] The Stock Market Was Bad […]
[…] Further Reading: GLD’s Fall From Grace Torturing Historical Market Data Was the 1966-1982 Stock Market Really That Bad? […]
[…] Reading: Was the 1966-1982 Stock Market Really That Bad? The Joy of Investing in Down Markets Enduring Lessons from the Financial […]
[…] look at the flipside, which is a poor performing market that so many are now calling for. The 1966-1981 period was one of the more difficult market environments to navigate in the post-WWII era for a simple […]
[…] Reading: Was the 1966-1982 Market Really That Bad? What About the […]
The Dow Jones Industrial Average ranged from 1300 to 7300 between the years 1914 and 1982. Yet between from 1982 until the present it rose from 2000 to 18000. What changed?
Your graph is from here: Dow Jones 100 Year Historical Chart and it does NOT show the raw value of the Dow Jones – it’s inflation-adjusted. Without that, it looks like this: So what happened is really just that the 70s had a relatively stagnant stock…
[…] Was the 1966-1982 Stock Market Really That Bad? – Was the 1966-1982 Stock Market Really That Bad? Posted June 19, 2014 by Ben Carlson “Investment success accrues not so much to the brilliant as to the disciplined.” […]
[…] the S&P 500 was up 6% per year in the 1966-1981 period, many consider this a sideways market because the Dow went nowhere from a price perspective and […]
[…] the S&P 500 was up 6% per year in the 1966-1981 period, many consider this a sideways market because the Dow went nowhere from a price perspective and […]