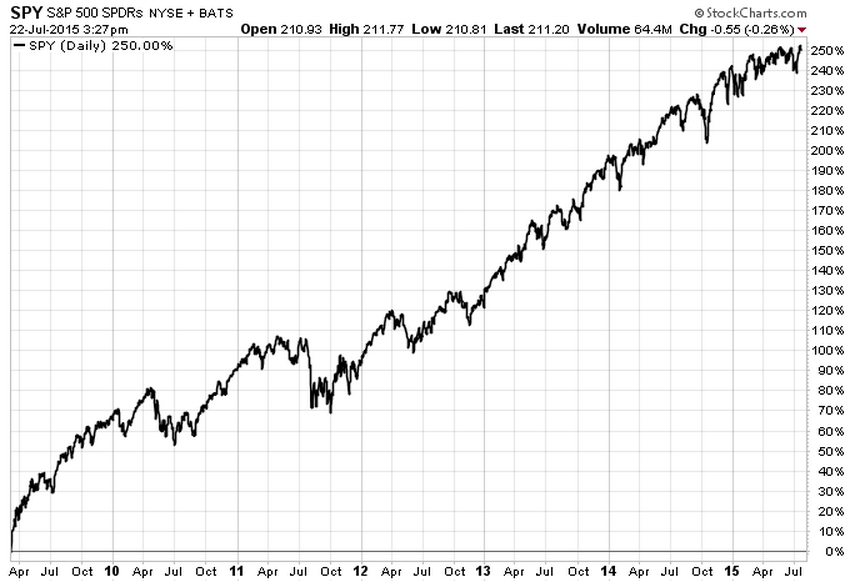
Stocks have been on an absolute tear since they bottomed out in 2009:
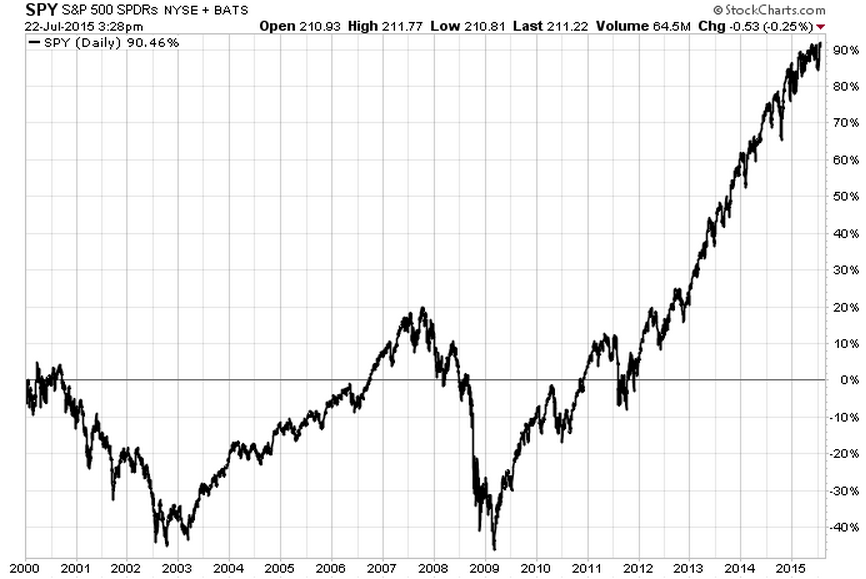
But since the market peaked in early 2000, U.S. stocks haven’t really done much for investors as we’ve gone through a series of booms and busts:
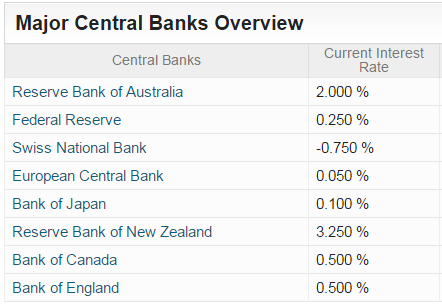
On the other hand, interest rates around the globe are at historically low levels:
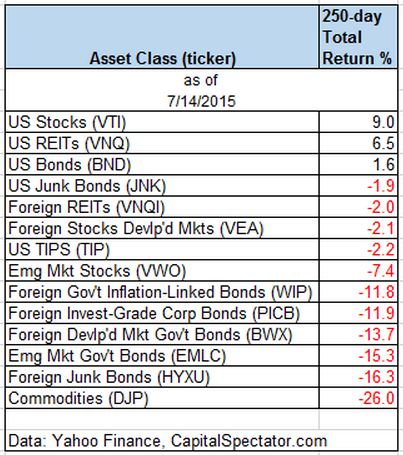
Nevertheless, it’s hard to say that these return numbers from global markets suggest a worldwide bubble gone mad (via Capital Speculator):
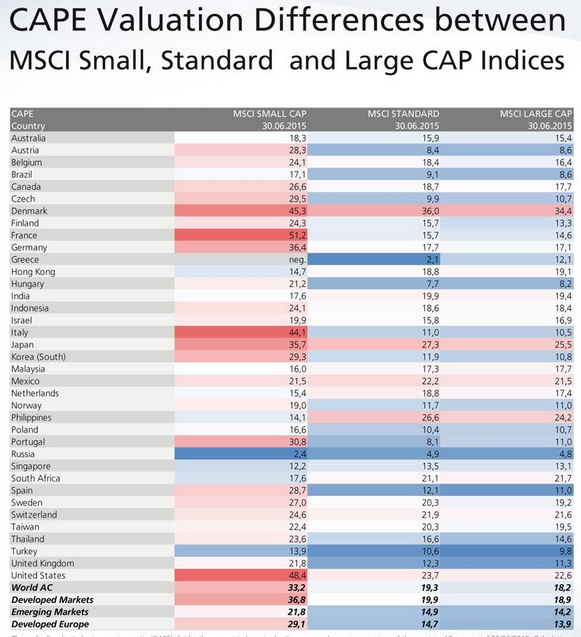
However, stock market valuations are above average in most of the large developed market countries around the globe (via @CAPE_invest):
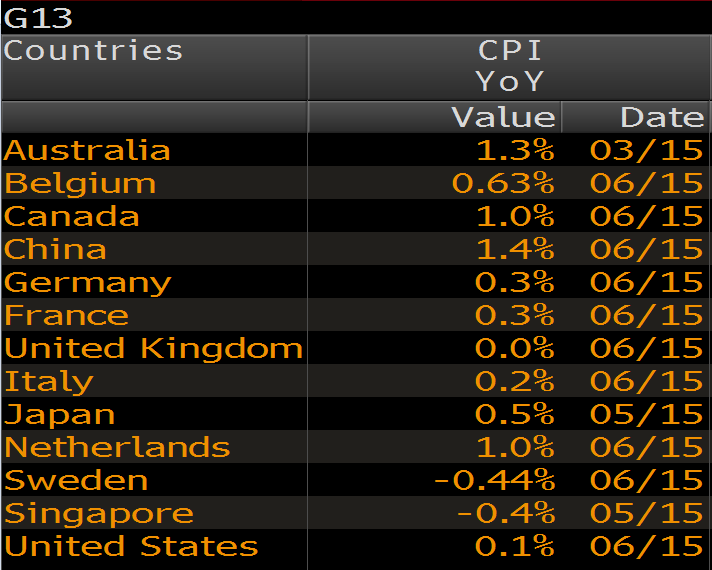
Having said that, valuations may not be as stretched as they appear compared to the subdued inflation rates in developed countries:
It’s also worth remembering that the Fed will have to raise rates in the future, possibly before the end of 2015:

Which could mean the end for a 30+ year bond bull market:
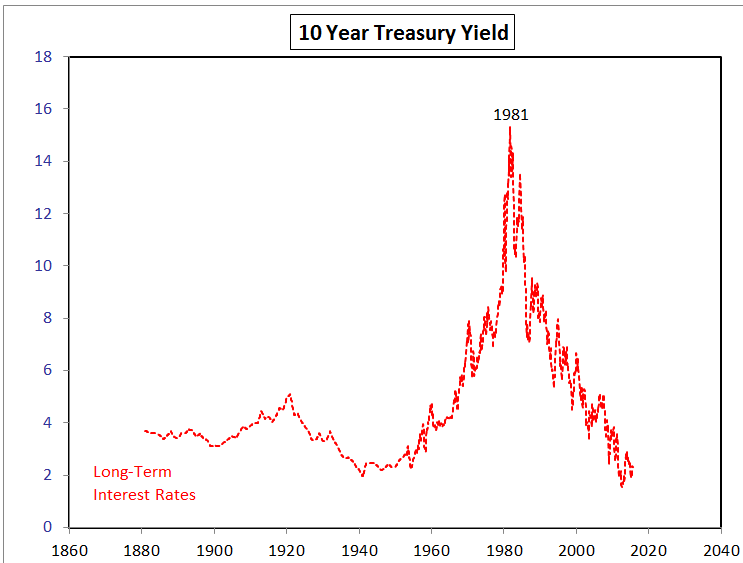
Yet historically bond market “bubbles” are not the same thing as a stock market bubble.
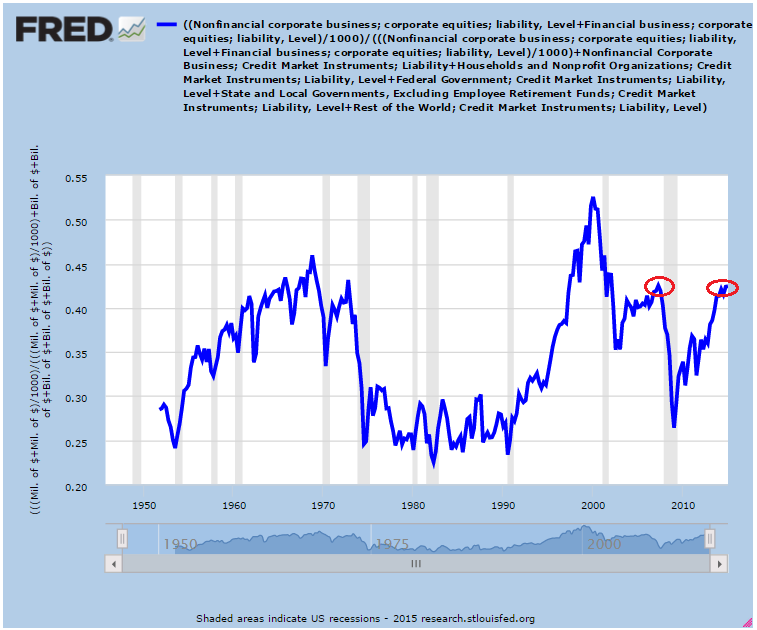
Many think we’re in another stock bubble because equity ownership is now back to the 2007 peak:
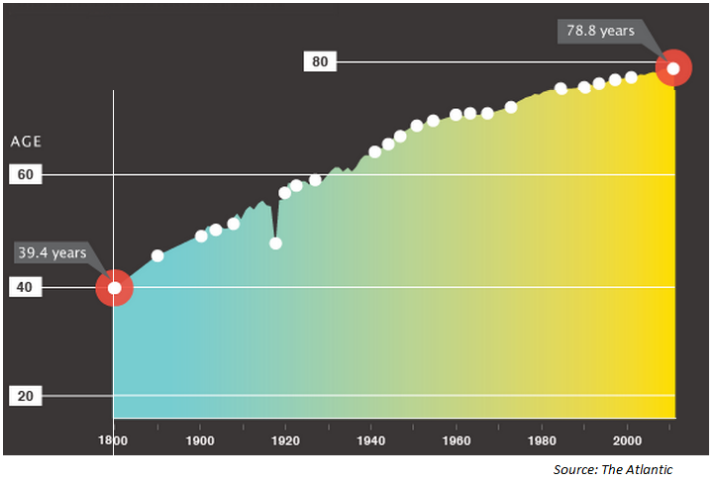
In spite of this data, you could make an argument for people holding more stocks in their portfolios for the simple fact that people are living longer than ever, so maybe they need more stocks to grow their money in retirement:
All of which is to say…the markets are confusing.
You could play point-counterpoint all day long with any piece of market data. The trick is to always see both sides of the debate before making a big decision. Even with access to more information than we know what to do with, some investors are still able to focus exclusively on only those facts that back up their current line of thinking. The Internet may be the biggest source of deflation ever invented, but it’s also the biggest source of inflation for people’s confirmation bias.
You could pick any single data point that aligns with your current positioning and build your narrative around it to make yourself feel better about your investment stance. But unless you’re able to see all sides of a debate you’ll never be able to make rational decisions when it comes to the markets. There’s something to be said for nuance, perspective and context when it comes to analyzing complex systems such as the markets.
The other lesson here is the markets are never easy. As Charlie Munger once said, “It’s not supposed to be easy. Anyone who finds it easy is stupid.”
Further Reading:
How to Win Any Argument About the Markets
Perma-Arguments

A couple thoughts:
I look at the period from 1942 to 1957 when the ten year never went over 3%. Was that hangover from the Great Depression? Are we a similar interest rate environment? I suspect so, but you can never be sure. What’s the greater risk over the next few years? Deflation or Inflation? I must confess I don’t know. The global economic data is pretty mixed.
I have really view CAPE with incredible suspect. The average everyone yells about includes data from the 19th century. Really? Markets haven’t changed, the economy hasn’t changed? The average CAPE from 1985 is 23 and median is 21. Given that the market doesn’t look too overvalued.
I also think the economy has moved toward healthcare and technology, which tend be low capital expenditures but high R&D expenses. With R&D expense recognized immediately and capital expenditures being amortized over multiple years, I would argue that today’s companies demand higher PE ratios vs the industrial high CapEx companies of 100 years ago.
While I have my issues with CAPE, I wouldn’t call myself a raging bull. I have pretty mixed feelings about the market. So I’m staying diversified, and when a market correction happens, I will be ready to take advantage of it by increasing my stock weightings.
Thanks for the article!
Keith
Rates were kept low for WWII but there’s also a lot to be said for a huge hangover from the Great Depression. People’s perception of risk was fundamentally changed for decades.
Here are a few past posts on CAPE if you haven’t seen them:
https://awealthofcommonsense.com/cape-fear-of-lower-returns/
https://awealthofcommonsense.com/cape-ratio-range-historical-outcomes/
Something we really never had exept over the last 15+ years is the abuse of derivatives and the creation of a whole new sectors of them. I believe we don’t even have good data on the amount, I have seen numbers like 777 trillion. Also all the counter party transactions.
These are the black swans of hte future.
Well the deriviatives ended up playing a large role in the last crisis when counterparties started to go under so it’s certainly possible.
[…] Markets are never easy. (awealthofcommonsense) […]
[…] (if you don’t subscribe to him then you should stop reading me right now and do it) showed in a recent article that there are only three of fourteen asset classes up over the past 250 days, as of July 14. There […]