“This is just another of an endless series of experiences over time that have demonstrated that the future of security prices is never predictable.” – Benjamin Graham
Some high profile talking heads in the investment industry have been making the case that past averages of profit margins, earnings, P/E ratios and other valuation tools suggest that stocks need to crash or at the very least have poor returns going forward.
Henry Blodget of Business Insider has been pounding the table for a few months now that he thinks a there is a decent chance of a market crash in the S&P 500:
I still think there’s a decent chance that we’ll see a major decline in stock prices in the next year or two (a 30-50% price drop).
If not a crash then he thinks returns will be subpar going forward:
I think we’ll see average returns of about 2.5% per year for the next 10 years, a far cry from the 10% long-term average.
So what if Blodget is right? Aside from his crash predictions, what if we do get subpar returns for the next decade.
There are precedents for his forecasted returns. I looked back at the rolling 10 year average annual returns on the S&P 500.
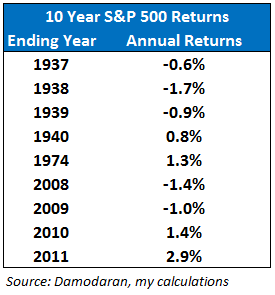
Since 1928, there have been 77 rolling ten year periods of annual returns through 2013. Out of those I found 9 that came fairly close to Blodget’s dire prediction.
Here they are sorted by the final year in each 10 year stretch:

Past periods of low returns have tended to cluster around major economic events such as the 1937-1940 returns which were all remnants of the Great Depression.
The 1974 period was during a brutal bear market in a highly inflationary environment while 2008-2011 all stem from the tech bust, the Great Recession or a combination of both.
So Blodget’s forecasted returns do have historical merit even though it’s only occurred in about 10% of all 10 year rolling calendar return cycles. It’s a low probability bet, but not out of the question.
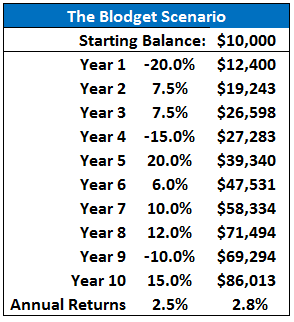
I decided to use a hypothetical exercise to see what 2.5% a year in the stock market might look like (not a forecast, just an illustration).
I’m assuming only a bear market and not a crash because 40-50% crashes only happen every 12 years or so on average (that doesn’t mean it can’t happen but it’s very rare).
I also decided to include some portfolio dollar values to make this exercise more realistic. I’m assuming our investor starts out with $10,000 and maxes out their IRA contribution every year for 10 years. Assuming no changes in the limits, that would be $5,500/year invested at the beginning of the year for simplicity’s sake.
Here’s what this would look like (I completely made up the return numbers so they came out to 2.5% annually because markets don’t move in a straight line):

If you are going to be a net contributor over the next decade, you should actually hope that Blodget’s scenario plays out.
Volatile or low returning markets actually work out better for those with a really long time horizon to put their money to work. Young investors in the early part of their career should pray for crappy markets while they ramp up their savings.
A simple dollar cost average into a volatile market like this example does help returns your returns (2.8% vs. 2.5%) a bit by investing on a regular basis. Our hypothetical investor made around $21K on the $65K they put to work.
But the real benefits are seen in the decades that follow after you have made periodic contributions in a low return environment.
Coming off those terrible 10 year periods in the past, the subsequent annual 10 year returns ranged from solid to spectacular (in chronological order): 8.7%, 6.6%, 8.5%, 12.7%, 14.6% and a shortened 5 year 17.7% from 2009 with the rest still to be determined.
If we assume an 8% annual return following 10 years of 2.5% gains, that $86K ending balance grows to almost $186K, not including any additional savings.
Investors with mature portfolios are the ones at risk in this scenario. Lucky for them, they aren’t constrained to invest in a single market like the S&P 500. They can create a global portfolio of different investment and asset classes and take advantage of volatile markets through the process of rebalancing.
Concerning a 10 year forecast for stock market returns, it’s entirely impossible to come up with a precise number.
Many of the numbers Blodget cites in his claims come from John Hussman, who uses a variety of approaches such as historical P/E multiples, Tobin’s Q, market cap to GDP and a host of other valuation models.
These models look good on paper on average. Unfortunately, the future is rarely average.
One of the simplest approaches I have come across is the Gordon Growth Model, which is the preferred method of respected author and investor William Bernstein.
This model can be broken down into the following equation:
Real (after-inflation) Expected Return = Dividend Yield + Real Dividend Growth Rate + Change in Valuation
The only knowable number here is the dividend yield which is currently around 2%. For the real growth rate in dividends, Bernstein uses historical results from Robert Shiller’s database which has averaged 1.3% a year.
Adding this to the dividend yield gives us a real return of about 3.3% per year. Let’s say inflation comes in at 2% for the next decade (a wild guess but that’s all anyone can do) and you get a nominal return of 5.3%.
Sure, this sounds reasonable.
Yet this forecast is more or less a complete guess just like all the other return forecasts because of that last piece of the equation, which is the change in valuation.
What this really means is the change in people’s emotions and what are they willing to pay for stocks.
This is the one variable that is impossible to quantify no matter how robust or intelligent your model is.
People’s moods change. Cycles are always different than the past. No one knows for sure how the future will unfold.
We know that buying after large losses has worked well in the past — price being the number one determinant of future returns. We also know that over the long-term (multiple decades) the markets have been a compounding machine if you can control your behavior.
Investors get into trouble when they try to use historical averages as market timing tools (which is not something Blodget is doing just yet…he says he’s staying invested). Long-term averages tell you nothing about what will happen next month, next year or even the next few years.
Sure, it helps to know where there is value in certain markets. But a singular focus on what you think future returns might be means your plan rests on outcomes over a solid process.
Having a rules-based, diversified investment plan helps to prepare you for a multitude of future environments no matter what return the market throws at you.
I don’t know if Blodget’s forecast will be right or not. We shall see. Investing in risky assets increases your expected returns, but reality will be what it will be.
Since we have no control over the market’s future returns, we must make sure our investment plan is set up to take advantage either way.
Sources:
Yes, I Still Think There’s A Decent Chance Of A Stock Market Crash — And, No, The Recent Recovery Doesn’t Reduce My Concern (Business Insider)
The Investor’s Manifesto

You mention that past bad returns are caused by bad markets (Great Depression, 1970s inflation).
Actually, Blodget’s and Hussman’s point is that bad returns are caused by high valuations. The poor 10-year returns in 2008, 2009, 2010 and 2011 were caused by high valuations in 1998, 1999, 2000 and 2001.
Today’s high valuations (based on PE10, dividend yield, Tobin’s Q) may cause poor 10-year returns in 2024.
You are correct. Higher valuations lead to lower returns (or put another way returns are much lower after a huge bull market). I don’t disagree with that point. We could see lower than avg rtns from here and probably will.
The point is that you can’t use long-term valuation techniques as market timing tools. It’s an impossible game. Blodget & Hussman said we hit bubble territory in early 2010 (see here: http://read.bi/MNb8NL). Since then the S&P is up 80% or almost 16% per year.
10 yr rtns from ’96 were almost 9%/yr. even though the mkt was probably overvalued at that point. It’s just very hard to take averages and use them to make absolute decisions.
Best bet is to stay away from the guessing game and think long-term.
[…] Last night on Twitter I posted the following table of 10 year S&P 500 annualized returns (which I’ve used in the past): […]
[…] Further Reading: What if Henry Blodget is right about the stock market? […]
[…] Reading: The Joy of Investing in Down Markets What if Henry Blodgett is Right About the Stock Market The Psychology of Lower […]
[…] I’ve been discussing over the past year or so (see here, here, here, here and here), there have been a number of high profile predictions made for lower than […]