It seems like there is always a good reason to worry about the stock market. When stocks are falling it feels like they can always fall further. And when stocks rise it feels like the peak is always right around the corner.
But what about when stocks rise by A LOT? That’s the situation we’re looking at right now with a massive rise from the bottom last March.
In a recent piece at Fortune I looked at the history of stock market moves after such a huge gain.
*******
The S&P 500 fell nearly 34% in just twenty-two trading sessions during the onset of the pandemic last spring. Then the market bottomed following a -2.9% down day on March 23, 2020. The following Monday, the market was up more than 9% and it hasn’t looked back ever since.
The one year return from that bottom was an astonishing 75% and that doesn’t include dividends. A gain of this magnitude in such a short period of time is a rarity in the stock market. In fact, this was the largest 12 month gain ever since 1950.
There were larger one year gains during the Great Depression but the losses were so much bigger back then it’s hard to make an apples-to-apples comparison with that time.
The question for many investors is this: What comes next?
It’s understandable many investors are worried these gains have come too far, too fast. There is no such thing as “easy” when it comes to investing in the markets because the future is always uncertain, but the past year or so has been mighty kind to investors in risk assets. It feels like the easy money has been made.
To get a better sense of how markets have reacted to booming gains like this, I looked at the returns over the ensuing one, three and five year periods to see what happened after enormous gains of the past.
To do this I took every 12 month gain of 50% or more since 1950 in the S&P 500 and then calculated the following 12, 36 and 60 month gains to see how much follow-through there was.
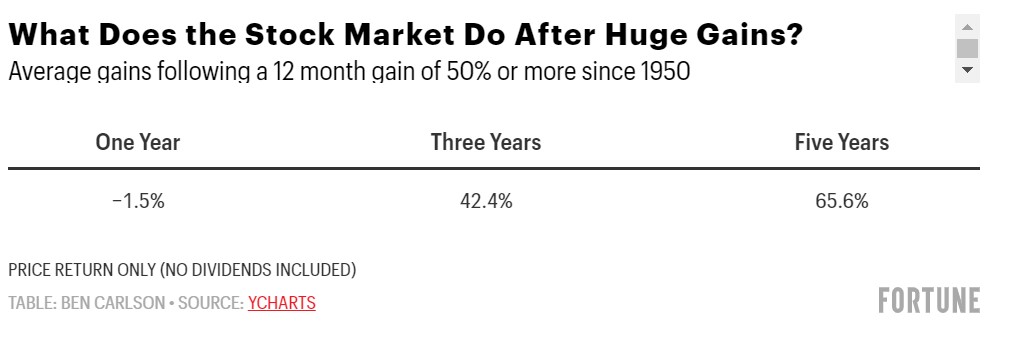
It’s not surprising the one year returns following such big gains showed a drop-off. Markets can’t go up in straight line forever. In fact, the 12 month return was negative 65% of the time following a gain of 50% or more in a one year period. As with most long-term market averages, there was a wide range of results here. One-quarter of one year periods saw double-digit gains while one-fifth of the time there were double-digit losses. So even though most of the time returns went south it’s not a foregone conclusion.
However, the further out you go the better the returns. There wasn’t a single 3 year period following a 12 month gain of 50% or more that showed a negative return. There was only one 5 year period with a loss and that one came at the tail end of the market crash of 2000-2002 that saw the market fall 50%.
The annual average returns over 3 and 5 years were 7% and 11%, respectively and these returns don’t include dividends.
These performance numbers may come as a surprise but there isn’t a ton of correlation between one year of returns and the next most of the time. This table shows the average returns in the stock market in a given year following either a loss, a double-digit loss, a gain or a double-digit gain the year before:
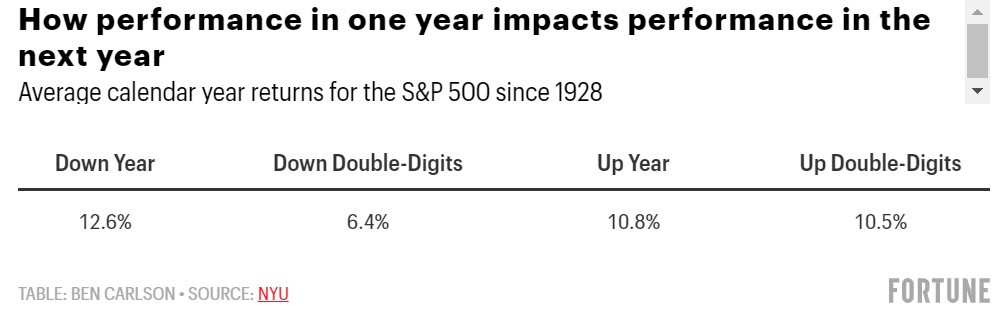
The returns in one year don’t really impact the returns in the next year all that much. And this is even more true when the stock market is up than when it is down. The average returns following a good year are right around the long-term averages.
There are always good reasons to talk yourself out of investing in the stock market. It’s possible the market will take a breather at some point because the gains have been so strong coming off the bottom last March. You could even make the case this would be healthy to avoid things getting too overheated.
But predicting the future path of the stock market based on what it has done over the past year is much harder than it sounds. Most of the time the stock market goes up but sometimes it goes down is about as good as it gets in terms of setting expectations for your portfolio.
It’s also true that the longer your time horizon, the better your odds are at seeing gains in the market.
This piece was originally published at Fortune.
