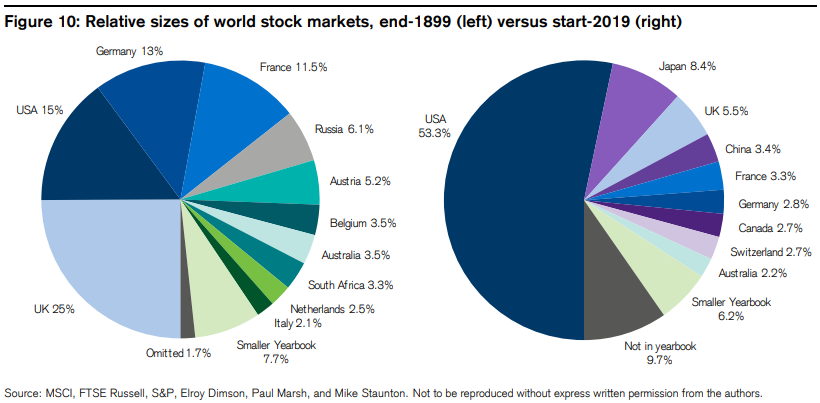
Elroy Dimson, Paul Marsh, and Mike Staunton have been publishing the following chart in their annual update for some time now and every single year it blows me away:

The U.S. market share looks like Pac Man preparing to eat the rest of the world.
Michael and I discussed some of the reasons for the U.S. dominance on the podcast a couple of weeks ago:
Regardless of why it happened, the only thing investors should care about from here is what happens next.
Will the U.S. continue to dominate the rest of the world going forward? Are there built-in competitive advantages the U.S. has over the rest of the world? How will this translate into economic and financial market gains in the years ahead?
No one actually knows the answers to these questions but this is the stuff that makes markets both interesting and challenging.
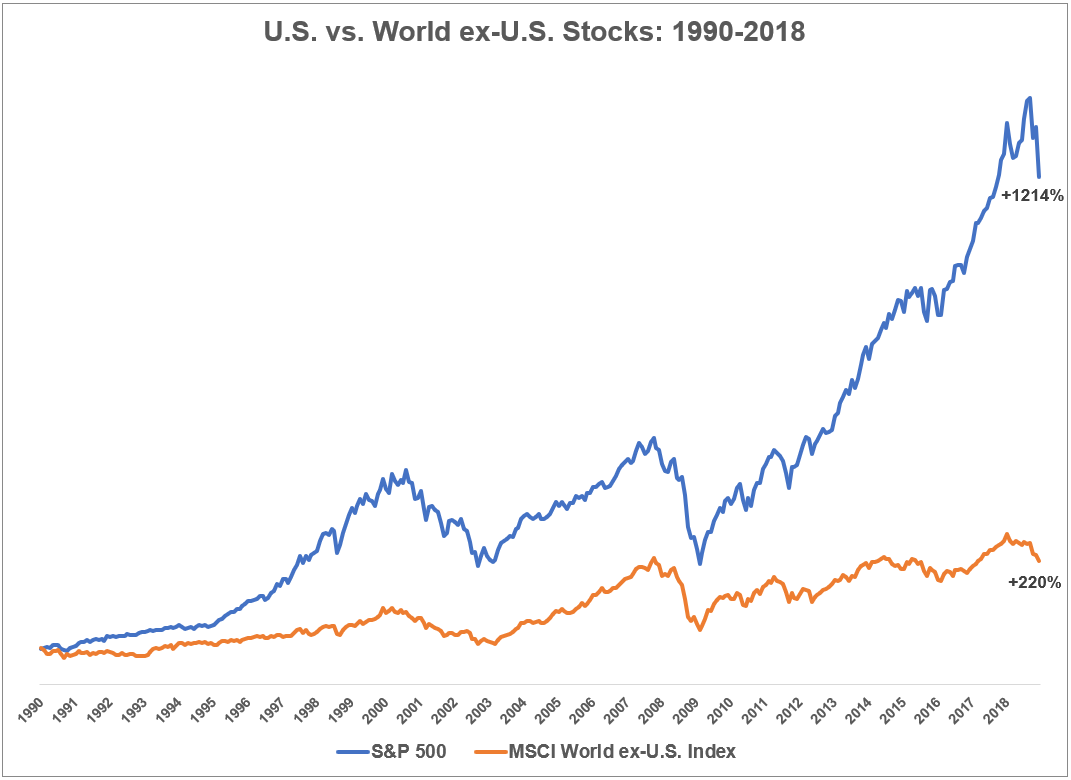
Not only has the U.S. dominated since the turn of the 20th century, but it also dominated the past 30 years or so as well:

USA! USA! USA!
This translates into annual returns of 9.3% for the S&P 500 and just 4.1% for the MSCI World ex-U.S. Things have been cyclical within this time frame but the overall picture skews heavily towards the U.S.
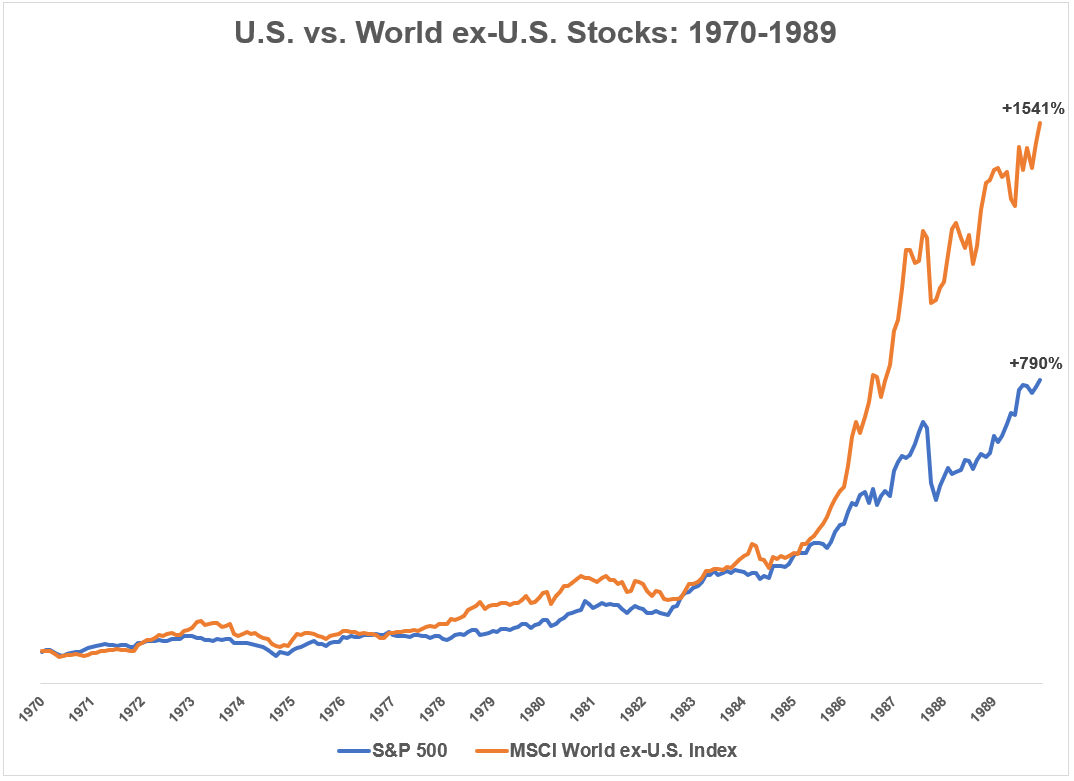
My access to reliable foreign market data only goes back to 1970 so there can’t be too many long-term non-overlapping periods. But taking the data back to the 20 years prior to 1990 paints a much different picture:

The 1970s and 1980s belonged to foreign markets, which outpaced the S&P 500 in terms of annual returns by almost 4% per year (15.0% vs. 11.6%).
This was driven mainly by Japan, which is the other country that stands out in terms of growth from 1900 to 2019. Japan was a rounding error in 1900 but now makes up more than 8% of the total.
This is even more remarkable when you consider their equity markets have basically gone nowhere since peaking in 1989.
The numbers used in the charts above become even more striking when we look at the performance of the MSCI Pacific Index, which is comprised mainly of Japan along with a smattering of Australia, Hong Kong, Singapore, and New Zealand.
From 1970-1989, this region was up almost 3700%!
In contrast to the 1970-1989 period of Pacific stock domination, the MSCI Pacific was up a total of just over 51% from 1990-2018. That’s some mean reversion.
Surprisingly, the MSCI Pacific still managed to outperform the MSCI World ex-U.S. over the full 1970-2018 period, with a total return of 5623% to 5145%.
U.S. markets have outperformed foreign markets over the entire 1970-2018 period as well, showing 10.2% annual returns to 8.4% returns for foreign stocks.
These numbers were much closer heading into the financial crisis. From 1970-2007, the S&P 500 saw annual returns of 11.1% against 10.9% returns for the MSCI World ex-U.S.
The crisis and its aftermath have been much kinder to U.S. markets than international stocks. From 2008-2018, the S&P was up 116.3% while foreign stocks were up just 3.4% in total.
The U.S. still has many competitive advantages over the rest of the world.
Having the world’s reserve currency has likely played a large role in this divergence as the dust settled from the financial crisis.
Our natural resources are plentiful. We have friendly allies and two enormous oceans on our borders. We have a strong military. Our tech companies dominate their industry. Our economy is highly diversified and dynamic. The demographic profile in the U.S. isn’t perfect but we’re far better off than the majority of the developed world.
I wouldn’t bet against the U.S. in the remainder of the 21st century.
But it’s worth pointing out that our country was more or less an emerging market in 1900. Things are much more stable and mature here now. No country has an economy like ours but the U.S. is now in the mature stage of development.
Emerging markets are also maturing but are far behind the U.S. in a myriad of ways.
It wasn’t a foregone conclusion the U.S. would dominate the next century in 1900.
It wasn’t a foregone conclusion Japan would dominate the 70s and 80s.
It wasn’t a foregone conclusion the U.S. would remain the cleanest dirty shirt in the hamper in the 10 years following the biggest financial crisis since the Great Depression.
The sample size for the big cycles in U.S. versus the world is basically two.
I honestly don’t know if it’s harder to predict the financial markets over the next 20-30 years or the next 100-120 years.
All I know is no one else has the ability to predict either of these time horizons with anything approaching certainty.
My only guess is whatever happens over the coming decades will likely surprise a great number of investors who assume they know exactly what’s going to happen.
