In the latest Jack Reacher book, The Midnight Line by Lee Child, Reacher is forced to make a decision without having all of the facts.
He’s trying to track down the owner of an Army ring and has to make an educated guess about how to find her. He lays out the best case scenario and is asked by his partner how often the best case actually happens.
Reacher responds that the best case occurs, “More than never. Less than always.”
This isn’t a bad way to think through the range of possibilities when dealing with the financial markets.
People often try to equate the stock market with a casino. This analogy fails because in a casino at least you know the exact odds before you play (or at least you should). With the markets, there are no odds.
Much of investing requires a leap of faith — that growth will continue; people will continue to innovate; people will get up in the morning looking to improve their standing in life, markets will keep going up over the long-term, etc.
The way I think about the markets goes something like this: the future is always unknowable, history is a pretty good guide, you have to take the present into account, but anything is possible so expect the unexpected.
This isn’t the easy answer most investors would like to hear but unfortunately, it’s true.
As far as history goes it can help to think in terms of best, base, and worst case.
Here’s the best case:
- The S&P 500 returned 14.4% annually from 1949-1968.
- The MSCI Japan Index returned 22.4% annually from 1970-1989 (Japanese small caps returned close to 30% per year).
- The S&P 500 returned 17.7% annually from 1979-1999 (a 60/40 portfolio returned 14.5% per year).
- Emerging market stocks returned more than 37% annually from 2003-2007.
- The S&P 500 returned 15.1% per year from 2009-2017.
The base case:
- Stocks have seen an average annual increase of 21% in up years and a loss of 14% in down years since the late-1920s.
- Stocks see an annual gain in the 8-12% range just 5% of the time.
- 70% of all calendar year periods see double-digit gains or losses.
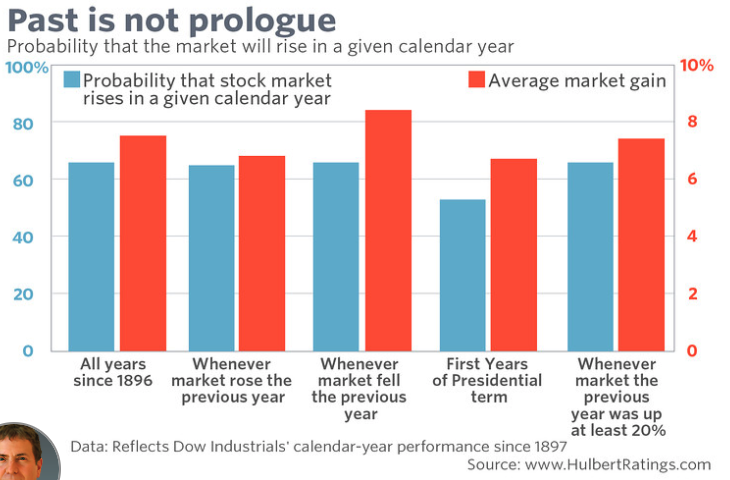
- Over the past 90 years, U.S. stocks have seen gains in 66 calendar years and losses in 24 years.
- There have been 34 double-digit drawdowns in the S&P since WWII (22 of those occurred outside of a recession).
- The average intra-year drawdown from peak-to-trough in the S&P 500 since 1950 is close to 14%.
- Most of the time stocks go up (via Mark Hulbert):

The worst case:
- Stocks fell almost 90% during the Great Depression.
- Stocks dropped 50% during a brutal recession in 1937.
- From the 1940s to the 1980s, long-term government bonds lost around 60% of their value after accounting for inflation.
- Stocks earned a 0% real return from 1966-1982 because inflation was running at 7% per year.
- Stocks crashed 22% in one day and 33% in one week in 1987.
- Japanese stocks are still well below their 1989 peak.
- Stocks got chopped in half in 2000-2002 and 2007-2009.
Obviously, this provides a wide range of potential outcomes which makes thing both compelling and infuriating in the markets.
Not only do we not know when the best, worst, or base case will prevail, there’s always an element of luck in terms of where you are in your investing lifecycle for how these different scenarios will impact your bottom line.
Young people should pray for the worst case scenario so they can put money in periodically at lower prices.
Retirees should pray for the best case so as to avoid seeing a bear market hurt they portfolio when they don’t have the savings to take advantage.
The path for each individual investor likely lies somewhere in between the best, base, and worst cases. Anyone who invests for the long run should expect to see some version of each over the course of their investing lifetime.
But if you’re looking to predict what will happen in the markets for the future scenario, there aren’t too many guarantees.
I’m constantly asked about the possibility of certain scenarios — market crashes, inflationary shocks, rising interest rates, low return environments, etc. — and the probability of their occurrence.
My new answer:
More than never. Less than always.
Further Reading:
Why It’s Always & Never Different This Time
Now here’s what I’ve been reading lately:
- Understanding how much you don’t know (Big Picture)
- An oral history of the greatest episode of The Office (Rolling Stone)
- Cracking the wallet (Humble Dollar)
- Why even bother to think about strategy? (Seth Godin)
- Your world’s about to get a whole lot bigger (Reformed Broker)
- Where does your biggest risk come from in your portfolio? (Irrelevant Investor)
- Having second thoughts as an early retiree? (Monevator)
- Why Bitcoin will never be the dominant form of money (Prag Cap)
- Failing slow and failing fast (Newfound Research)
