A reader asks:
I have a question about reconciling two very famous market parables. Ben, your story of “Bob, the World’s Worst Market Timer” perfectly illustrates the power of compounding and the importance of never selling, even if your entry points are disastrously bad. On the other hand, we frequently hear the statistic–often championed by Tom Lee–that if you miss the 10 best days in the market over a given decade, your overall returns are practically wiped out or even negative. My question is: How do these two concepts intersect? Is the secret to Bob’s ultimate success entirely dependent on the fact that, by never selling, he accidentally captured Tom Lee’s “10 best days” (which usually happen right in the middle of the crashes Bob bought into)? If we ran a simulation of a “Bob” who bought at the peaks, but panic-sold at the bottom and missed those 10 best bounce-back days, exactly how catastrophic would the math look compared to the original Bob? I’d love to hear your thoughts on how the “missing the best days” statistic contextualizes Bob’s survival.
Here’s a refresher on Bob for those who are new around here:
There’s no magic in Bob’s terrible market timing strategy because of how the best and worst days tend to occur.
Let’s look at the data to see why this is the case.
JP Morgan has a good chart on what happens if you miss just a handful of the best days:
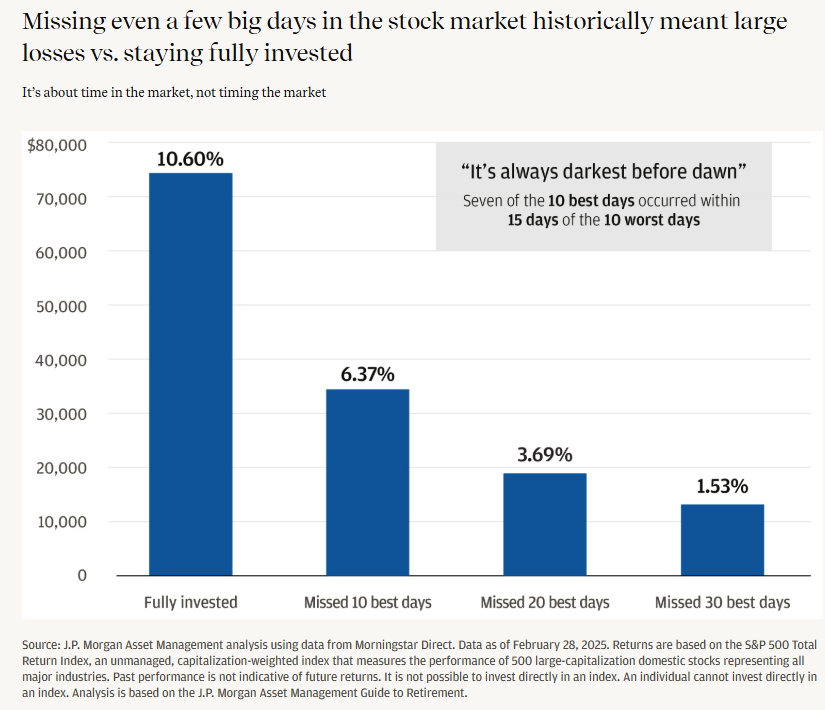
Missing the best 10 days would cut your annual return by 40%. Missing the best 30 days and the market’s return if a fraction of the long-term average.
Hard to believe, but true.
Here’s another way to look at this: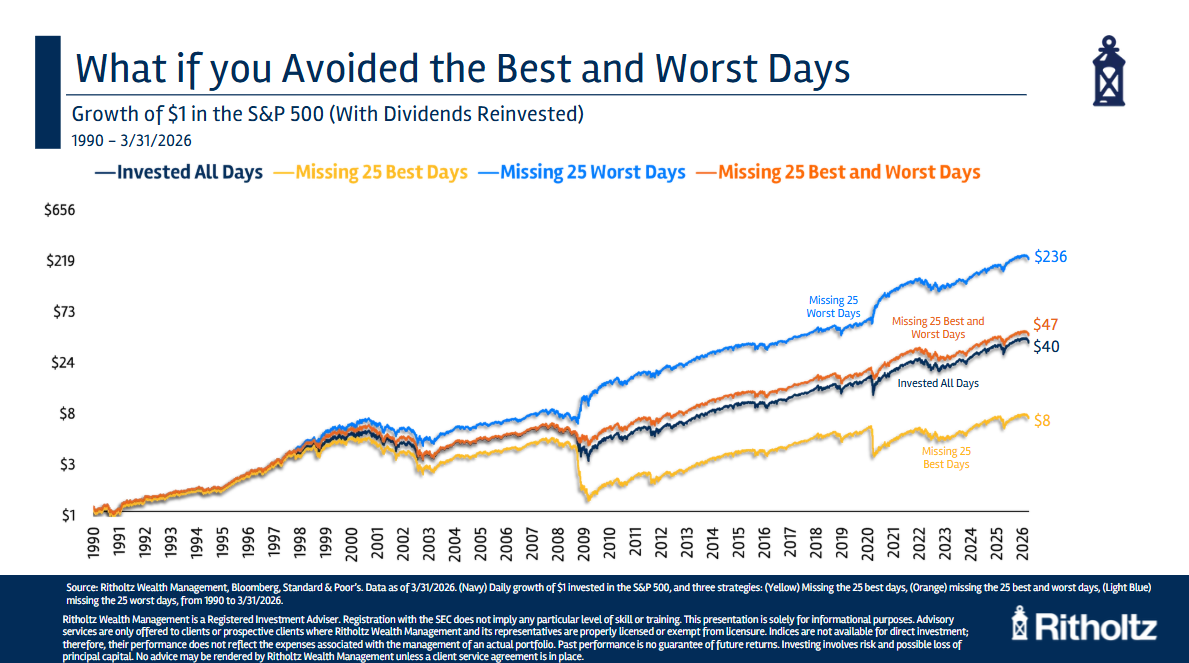
If you missed the 25 best days since 1990, $1 would have grown to just $8 versus $40 if you remained fully invested.
If you somehow could miss the 25 worst days, $1 grew to nearly $240.
However, if you could miss both the best and the worst days, it approximates the long-term buy and hold growth.1
Why is this the case?
One of the reasons no one has the ability to miss the just best days or just the worst days is because they tend to cluster together, mainly during turbulent market environments.
This chart from Exhibit A shows how the best and worst days have clustered together:
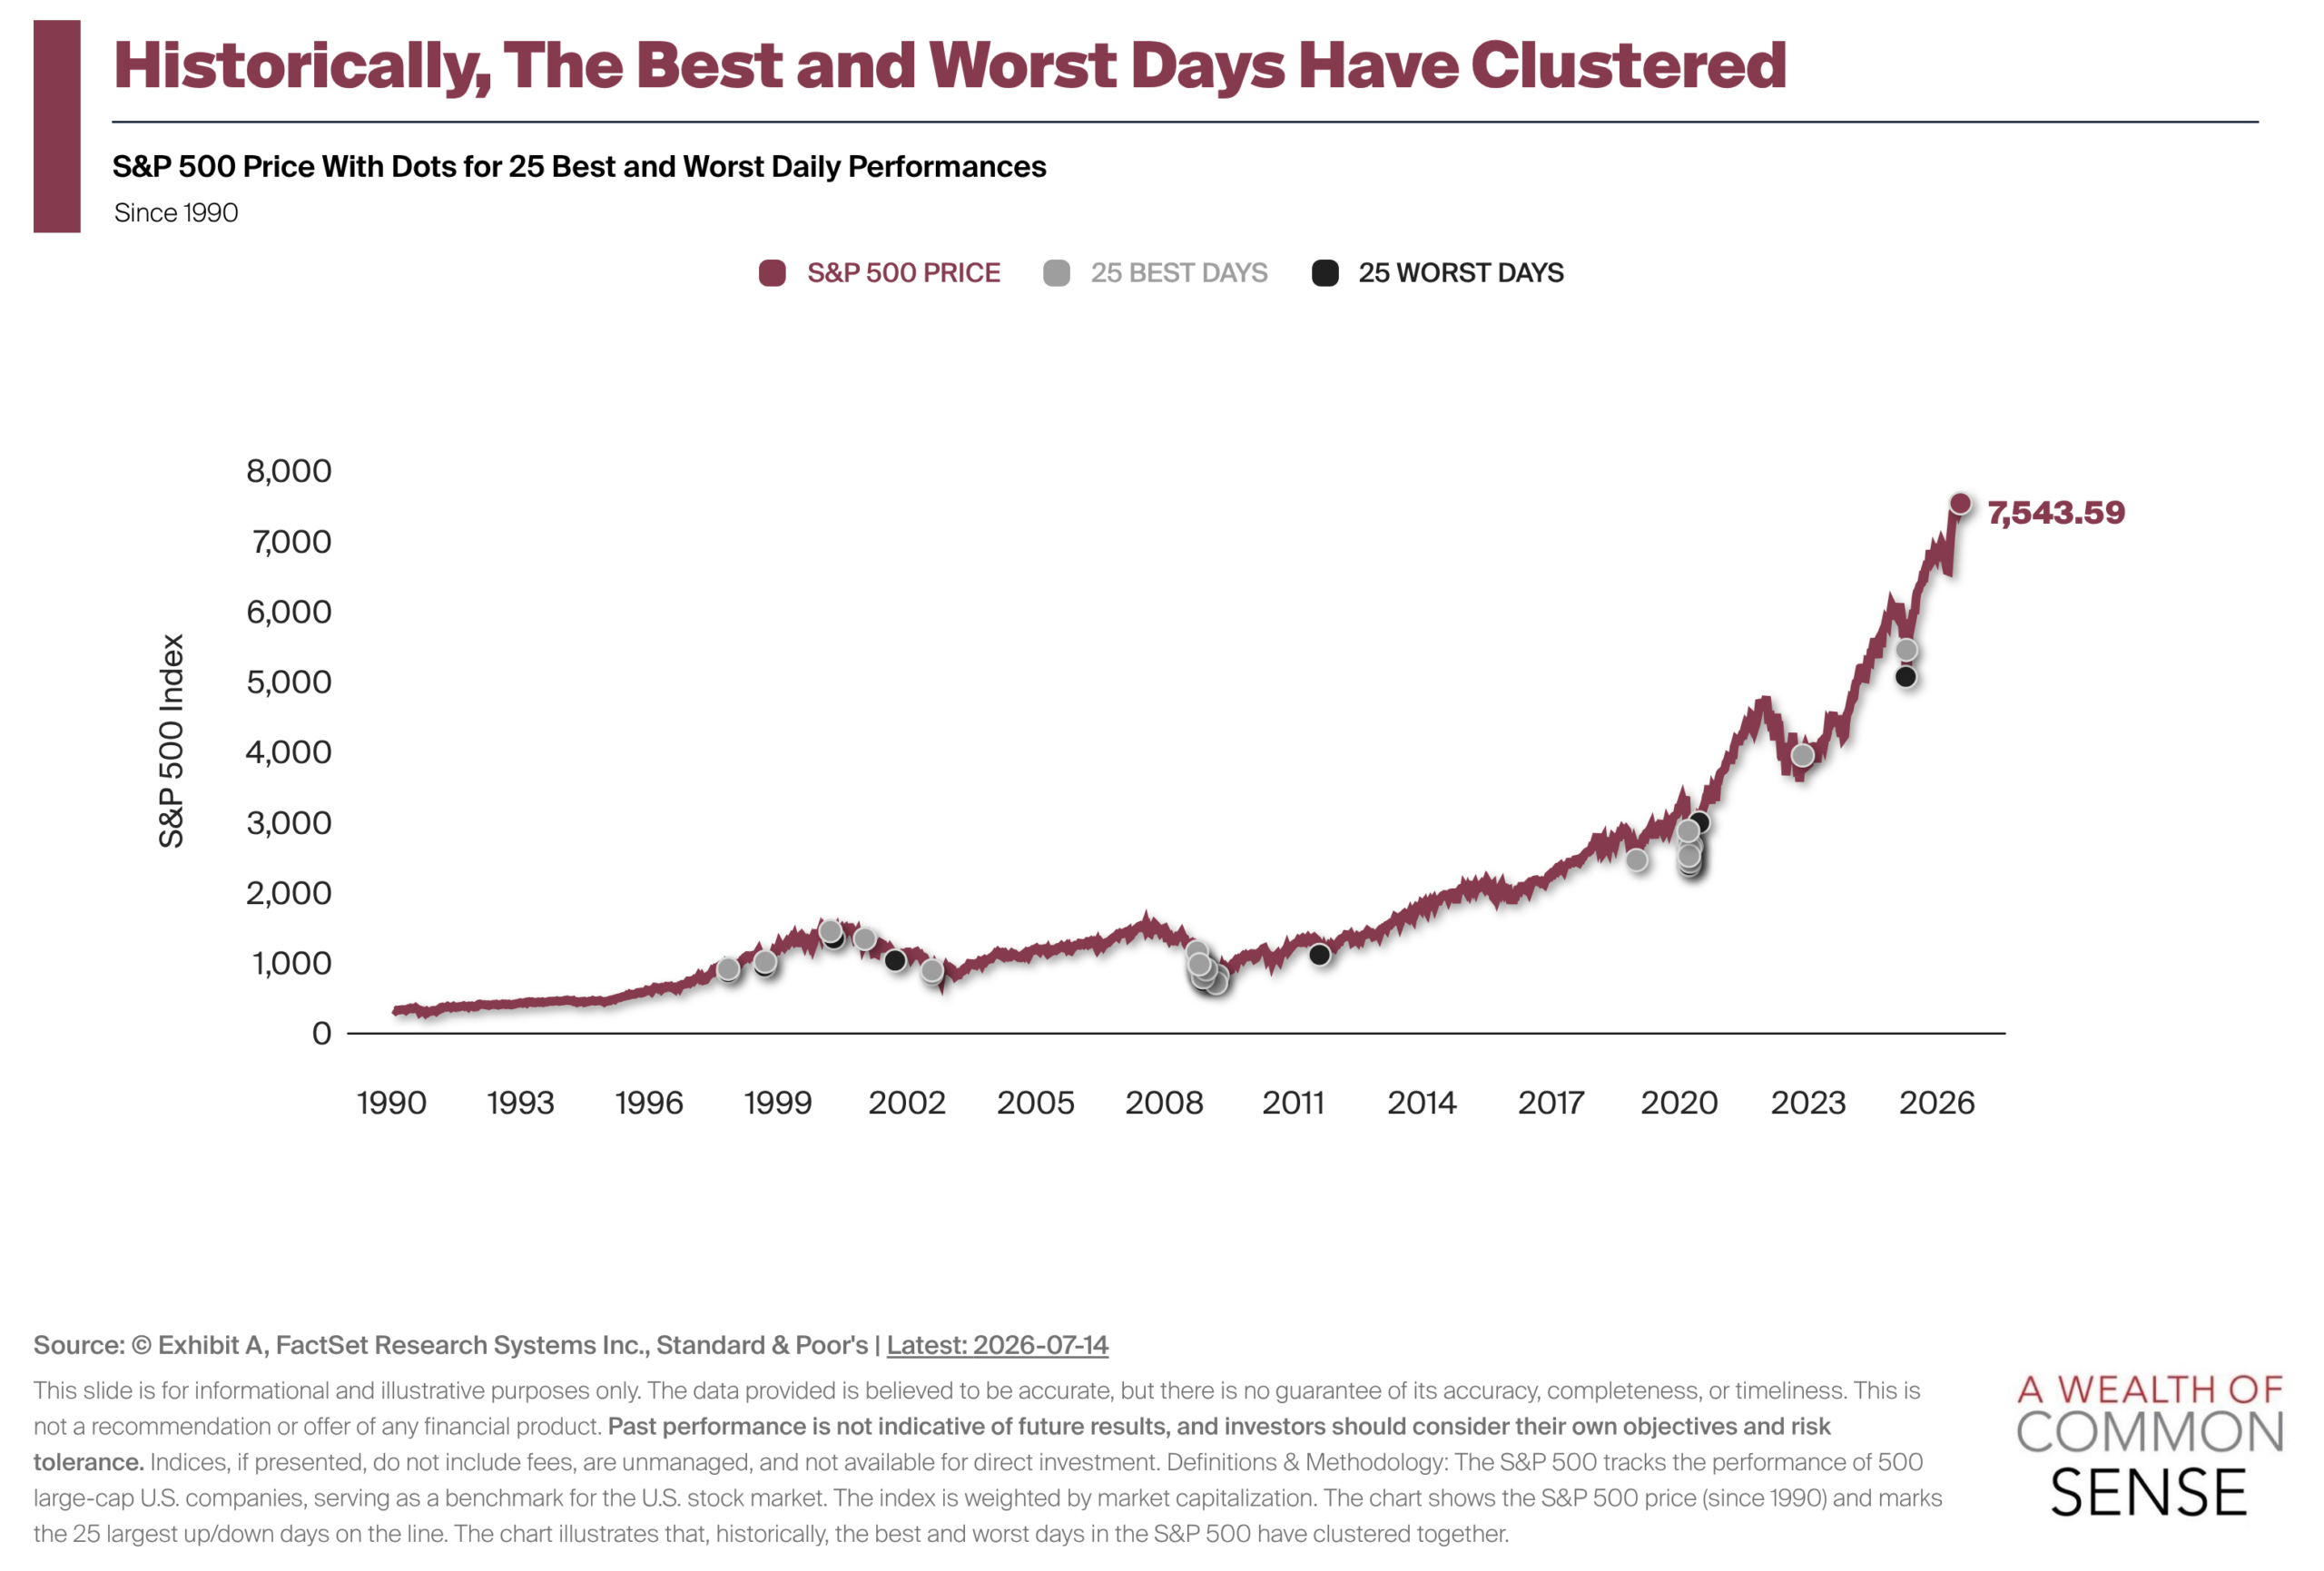
The best and worst days since 1990 have mostly occurred around the dot-com bust, the 2008 crash, the Covid crash and the 2022 inflation bear market.
Big moves tend to cluster like this for a number of reasons:
Volatility begets volatility. When markets get jumpy investor emotions get jumpy. The uncertainty rarely goes away in a hurry during a big downturn. Since losses hurt more than gains feel good, those heightened emotions cause more jittery moves from investors.
Panic works in both directions. Emotions drive markets in the short run but there are also structural factors at play. Forced selling, margin calls, profit-taking and a little bit of fear can cause a cascade of selling in the first place. Then you have short covering, bargain hunting and relief rallies from some combination of hope and policy response.
This leads to both panic selling and panic buying during a crash.
Herding is heightened when people lose money. Gustave Le Bon was a French psychologist who wrote The Crowd: A Study of the Popular Mind all the way back in 1895. The passage sums up his findings pretty well:
The most striking peculiarity presented by a psychological crowd is the following: Whoever be the individuals that compose it, however like or unlike be their mode of life, their occupations, their character, or their intelligence, the fact that they have been transformed into a crowd puts them in possession of a sort of collective mind that makes them feel, think and act in a manner quite different from that in which each individual of them would feel, think and act were he in a state of isolation. There are certain feelings that do not come into being, or do not transform themselves into acts, except in the case of individuals forming a crowd.
It feels safer to be in the crowd when volatility strikes.
That’s why the best and worst days happen close together. It’s also why timing the market is even harder in falling markets.
Did this phenomenon help Bob the world’s worst market timer?
No, Bob’s only saving grace was a long time horizon.
He was still forced to sit through the best days and the worst days which typically come after the peaks.
I discussed this question on an all new episode of Ask the Compound:
Taylor Hollis joined us on the show this week to answer questions about estate planning, paying off credit card debt, talking to your in-laws about money, advisors getting advisors and setting up your children for financial success.
Further Reading:
What If You Only Invested at Market Peaks?
1This is essentially what a trend-following strategy tries to accomplish.