A reader asks:
What is consumer debt doing? All this bad news and people are still spending like drunken sailors?! Where is the canary in the coalmine?
Fair question.
This entire decade people have wondered how the consumer remains so resilient in the face of higher inflation, gas price spikes (twice now), tariffs, a slowing labor market and constant worries about the possibilities of a recession.
And yet…
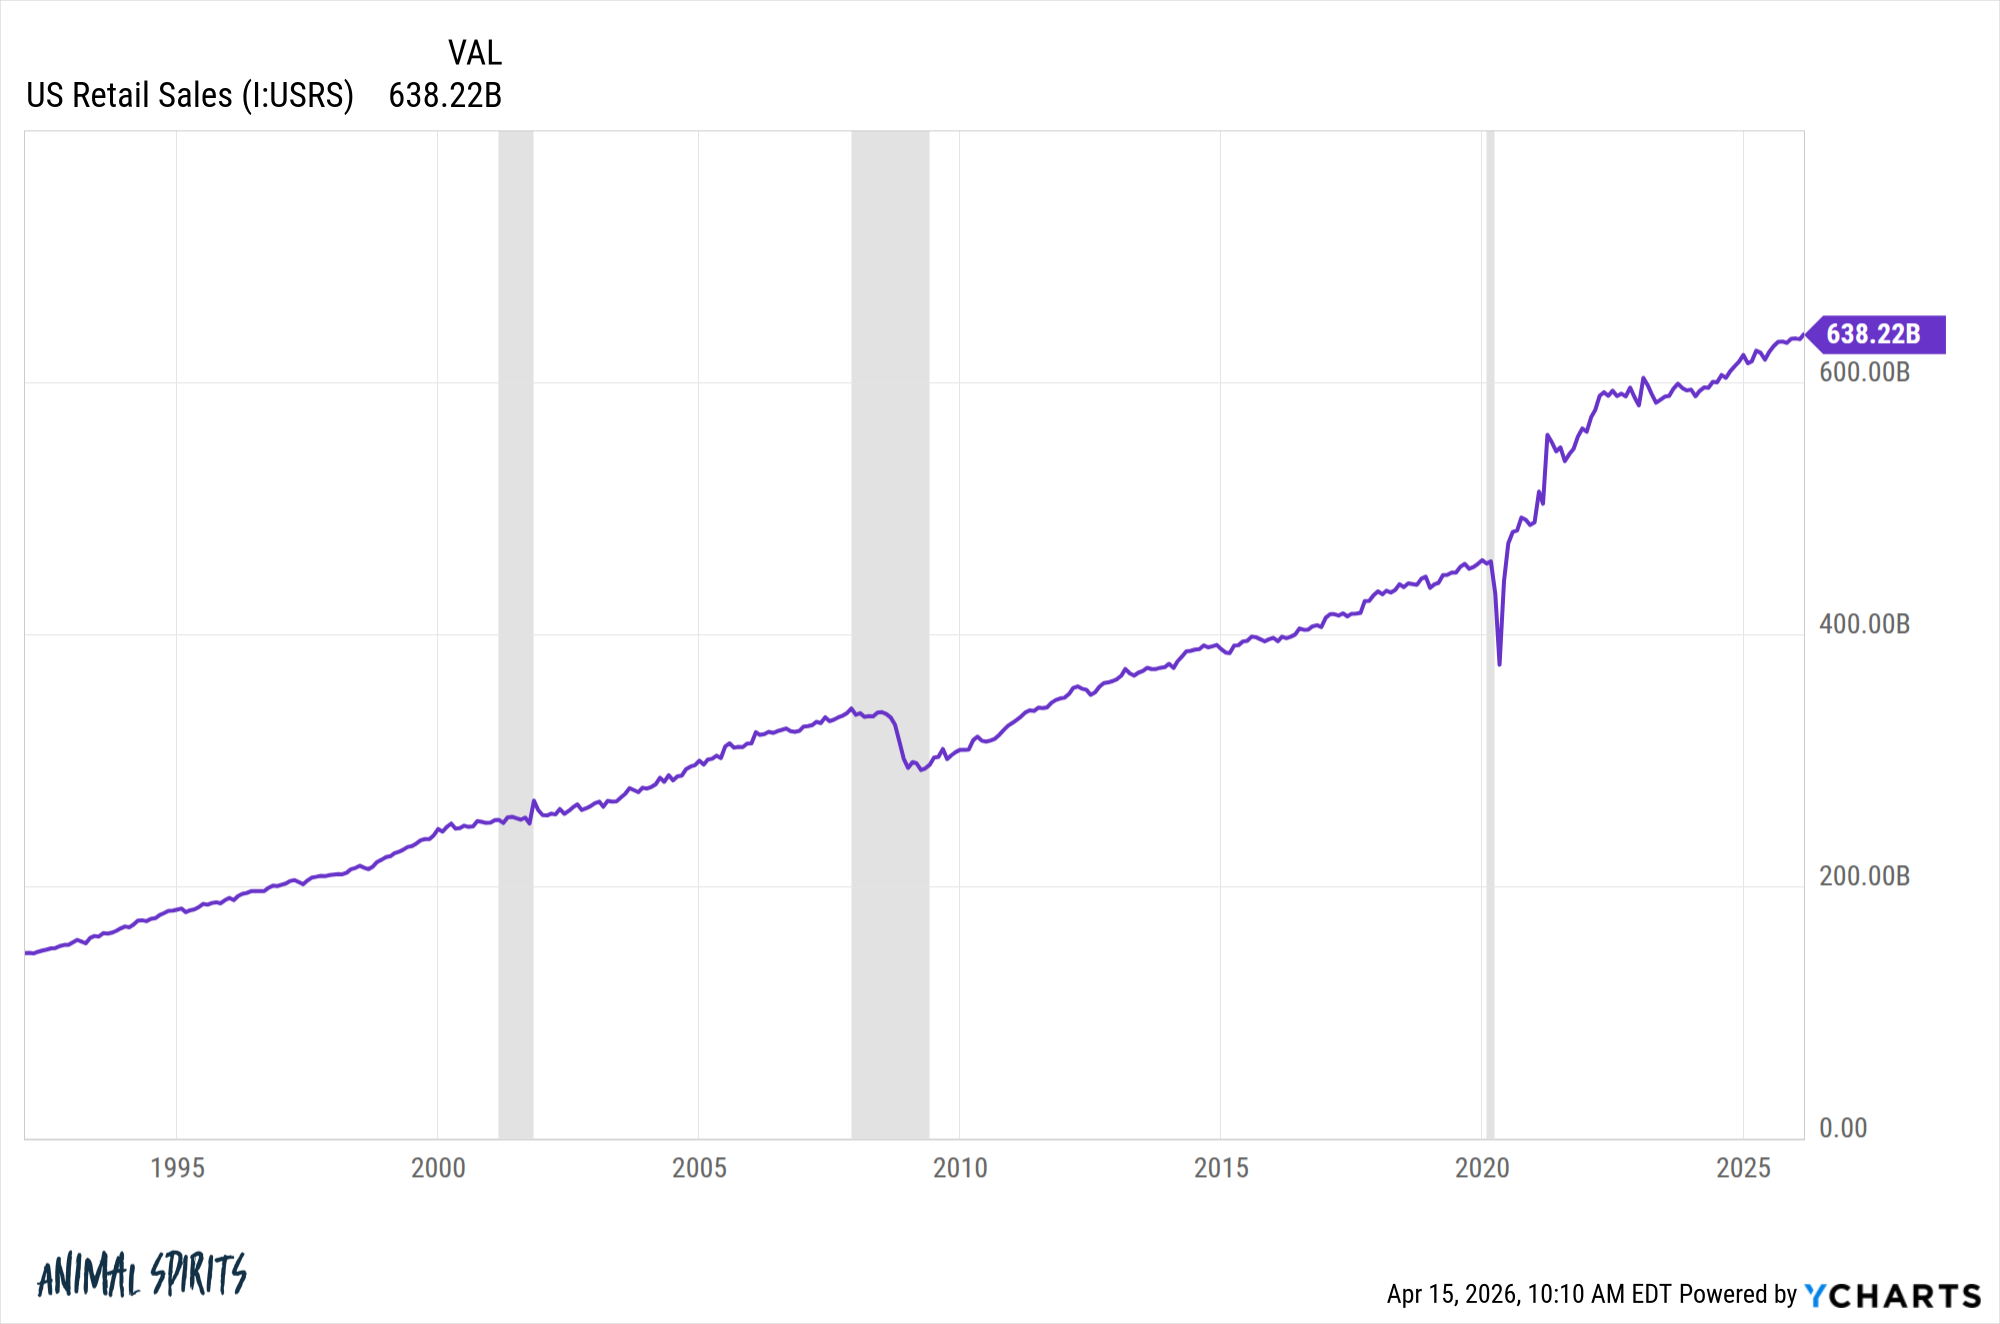
Just look at retail sales continuing to move higher:
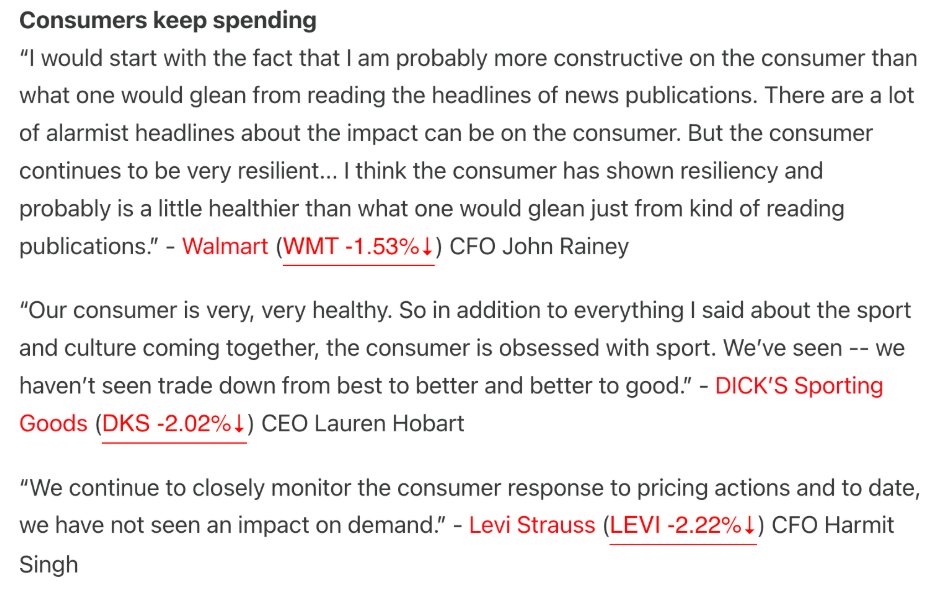
The Transcript shared some comments from recent earnings calls where the executives all agree the consumer remains in good shape, spending-wise:
Airline traffic also remains strong:
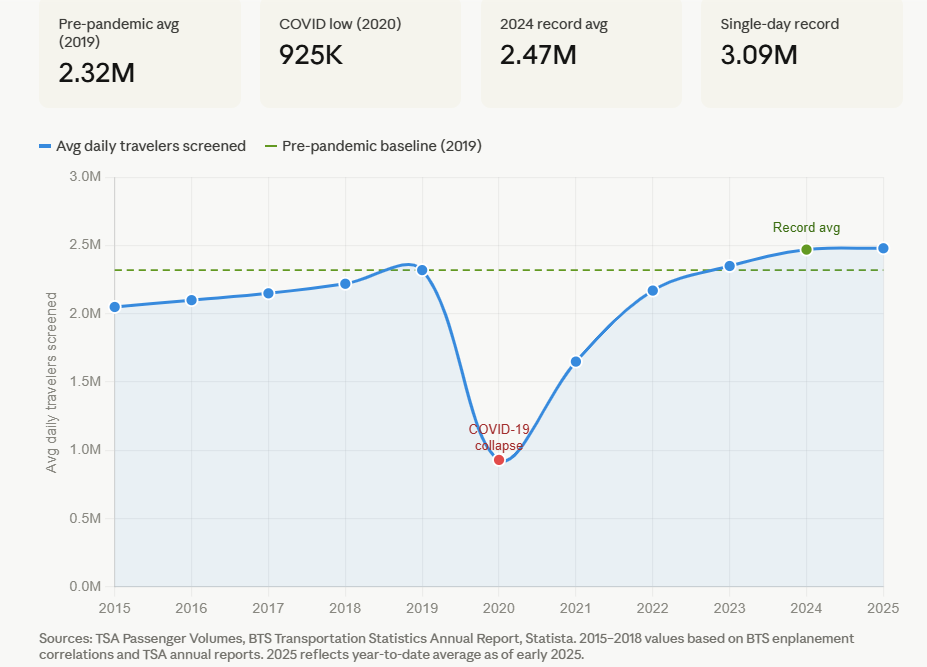
Households are still going on vacation. Restaurants are full. People are buying stuff.
How?
Why have all of the predictions about a consumer slowdown this decade been wrong up to this point?1
There are a few reasons.
Debt has increased in the 2020s for sure:
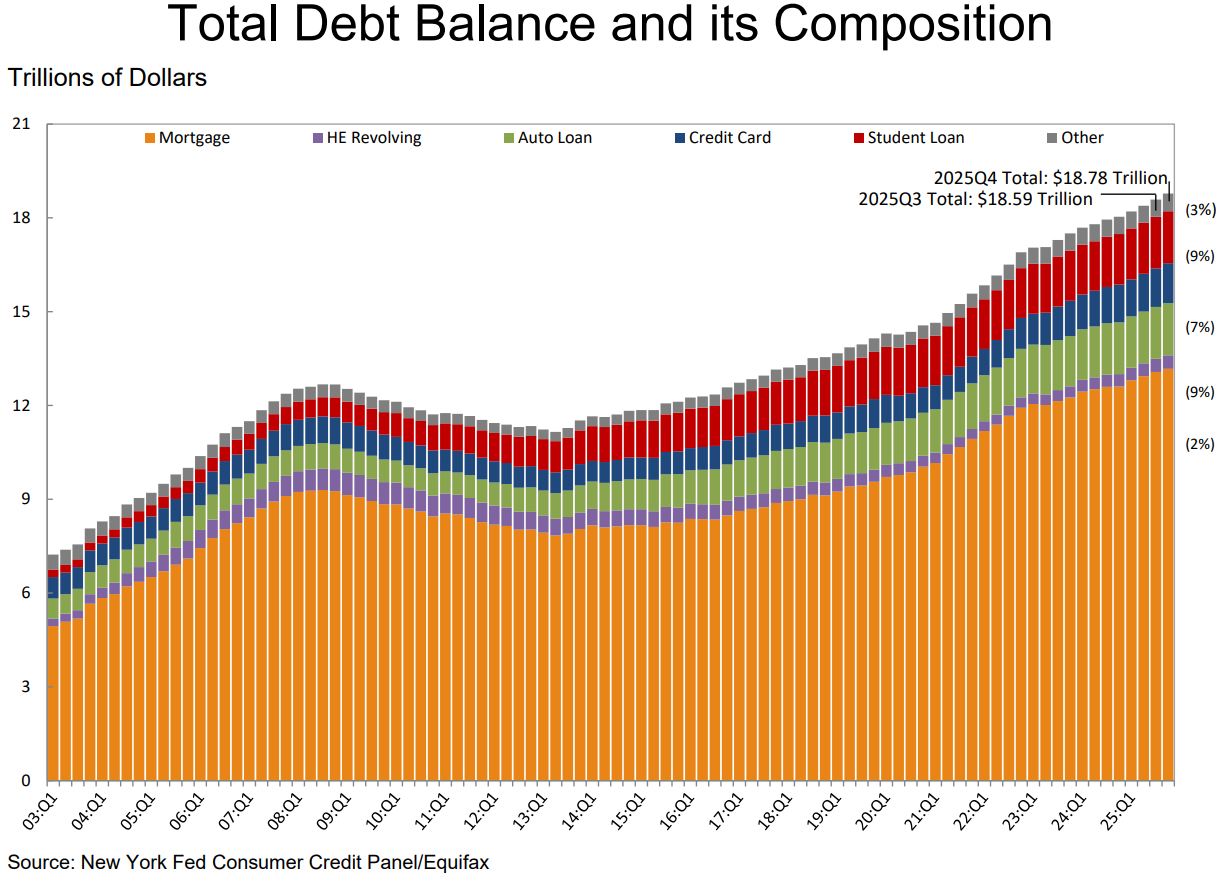
Consumer debt is much higher than the pre-pandemic days, increasing from $14.2 trillion at the end of 2019 to $18.8 trillion by the end of 2025.2
But you have to look at the debt in relation to the assets to avoid denominator blindness.
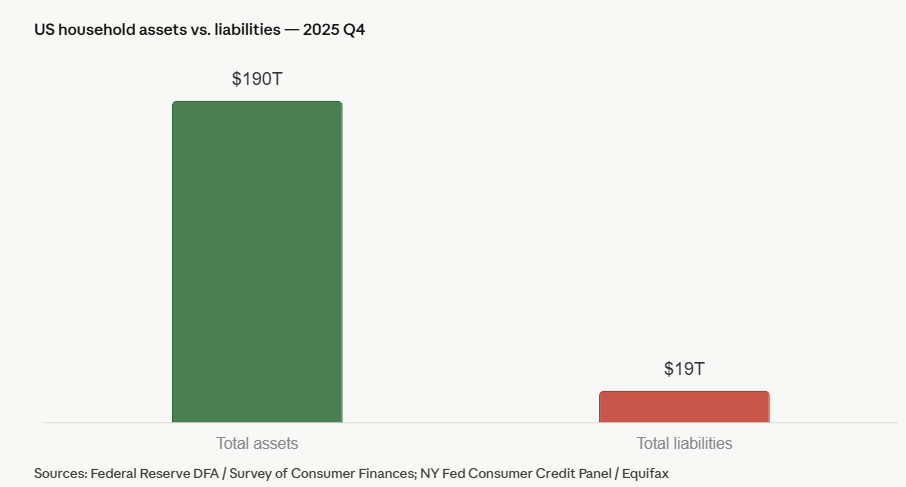
The assets dwarf the liabilities and it’s not even close. Plus, the growth of those assets has far outpaced the growth in debt by roughly two-to-one in the past six-plus years.
Although it always feels like the rich just keep getting richer, the bottom 90% has actually experienced larger relative gains in wealth in the 2020s:
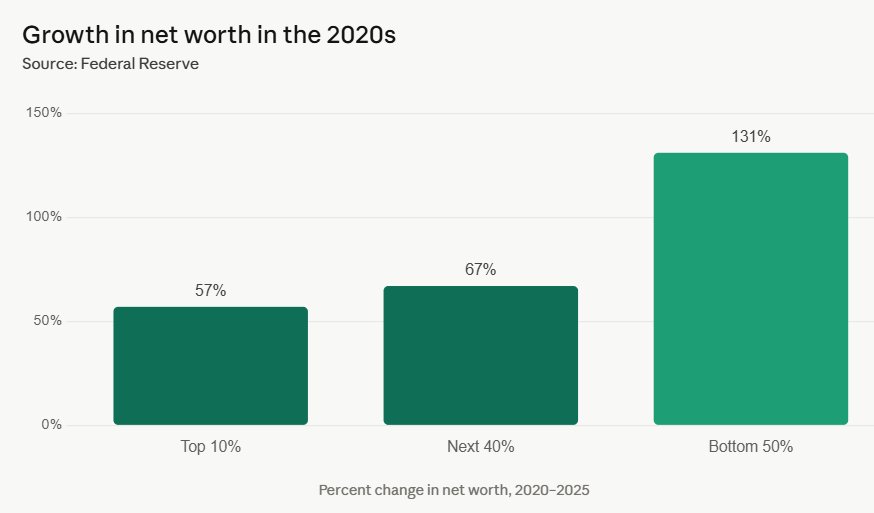
This is surprising, right?
Of course, the top 10% still control far more wealth than the bottom 90%. But collectively, everyone has gotten richer.
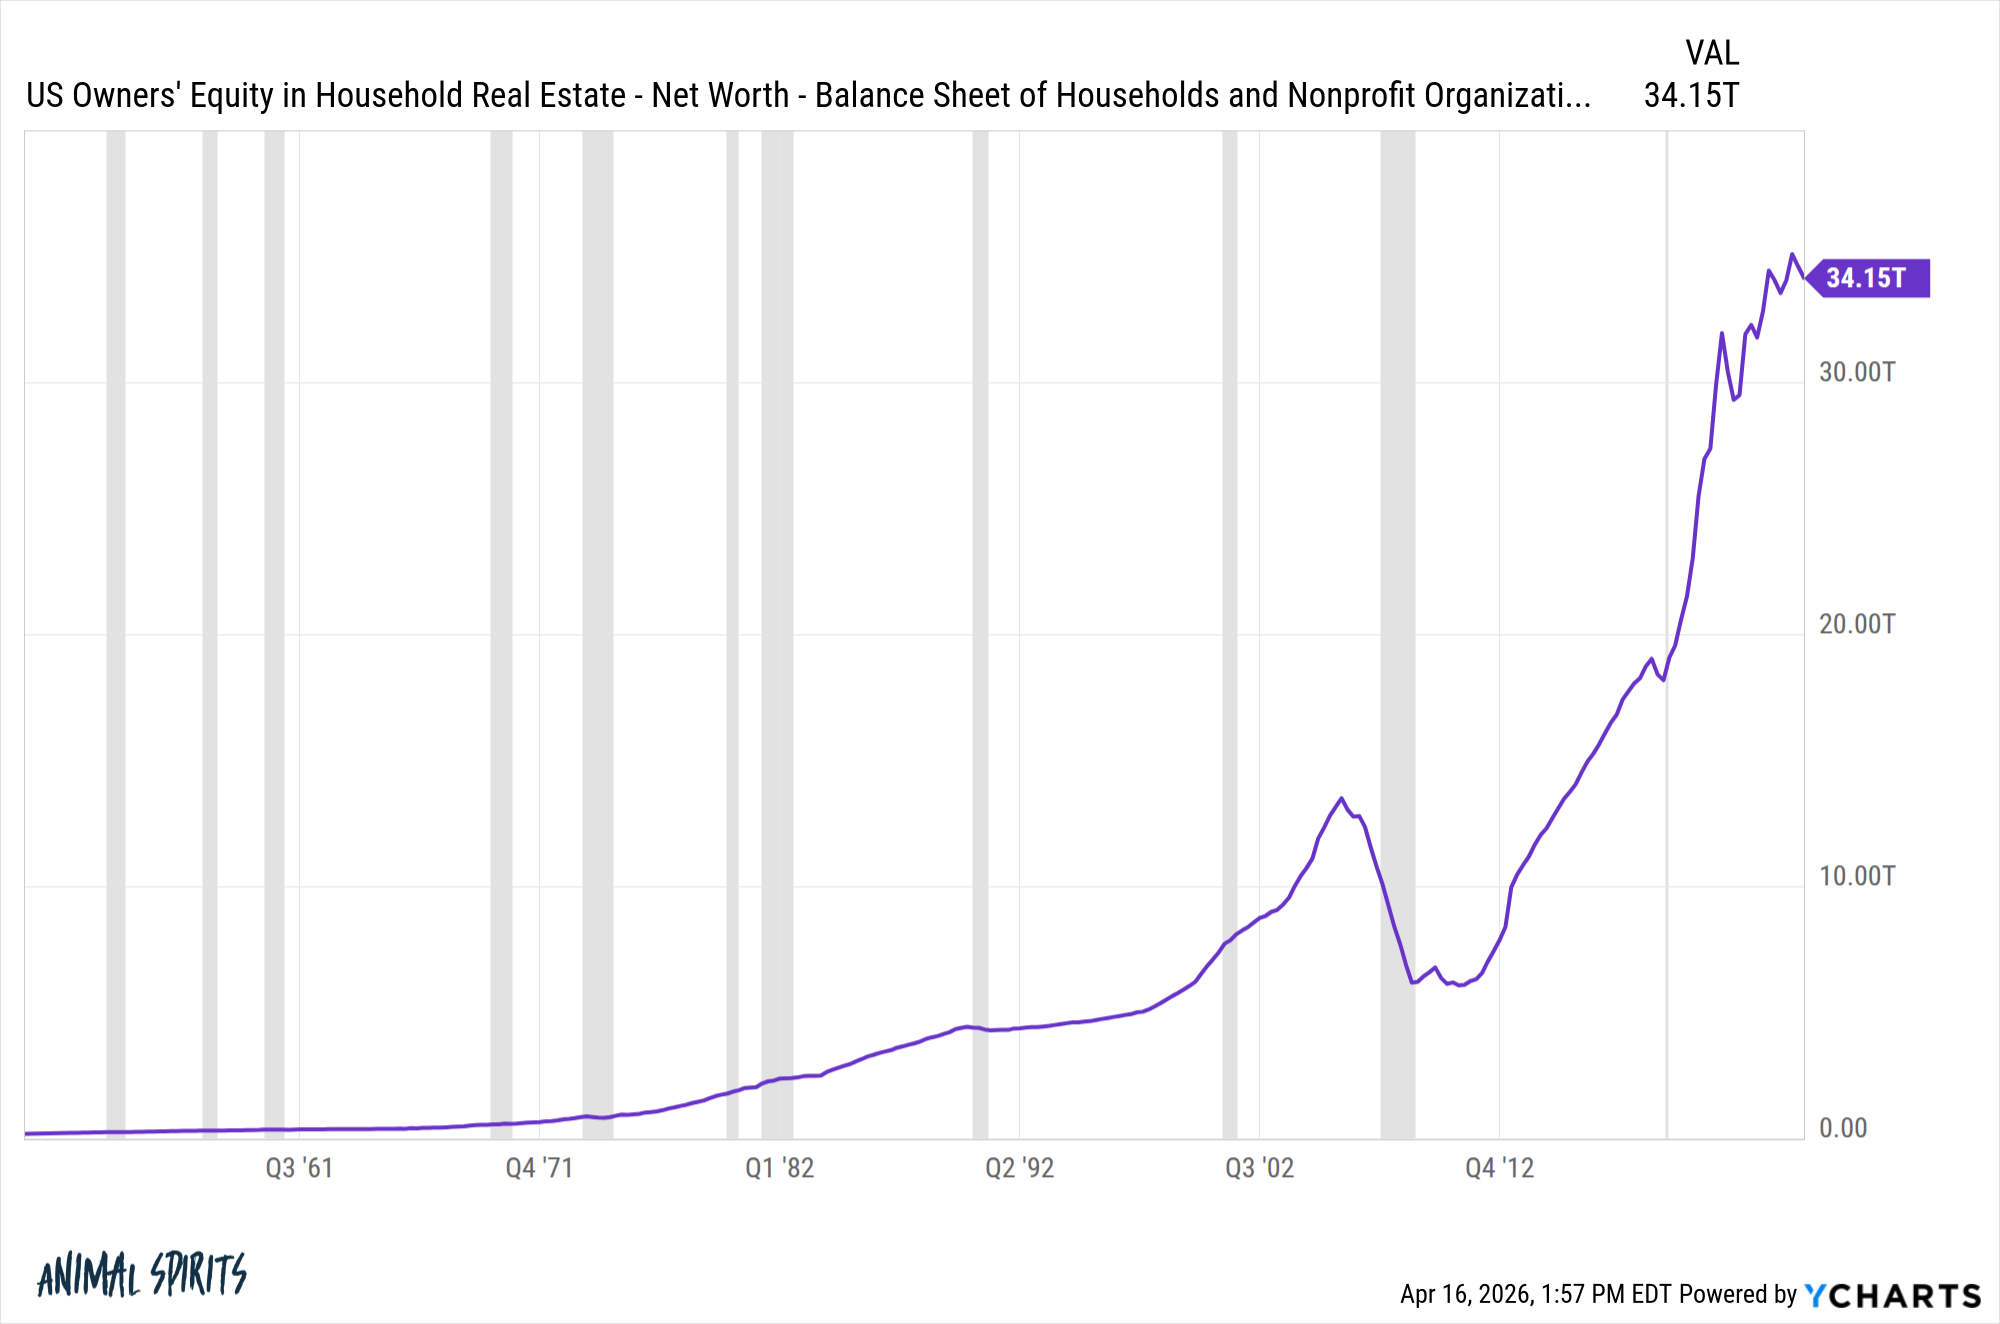
It’s hard to overstate how much wealth has been created in the stock and housing markets in the 2020s.
Home equity has nearly doubled since the end of 2019:
There is also nearly $8 trillion in money market assets:
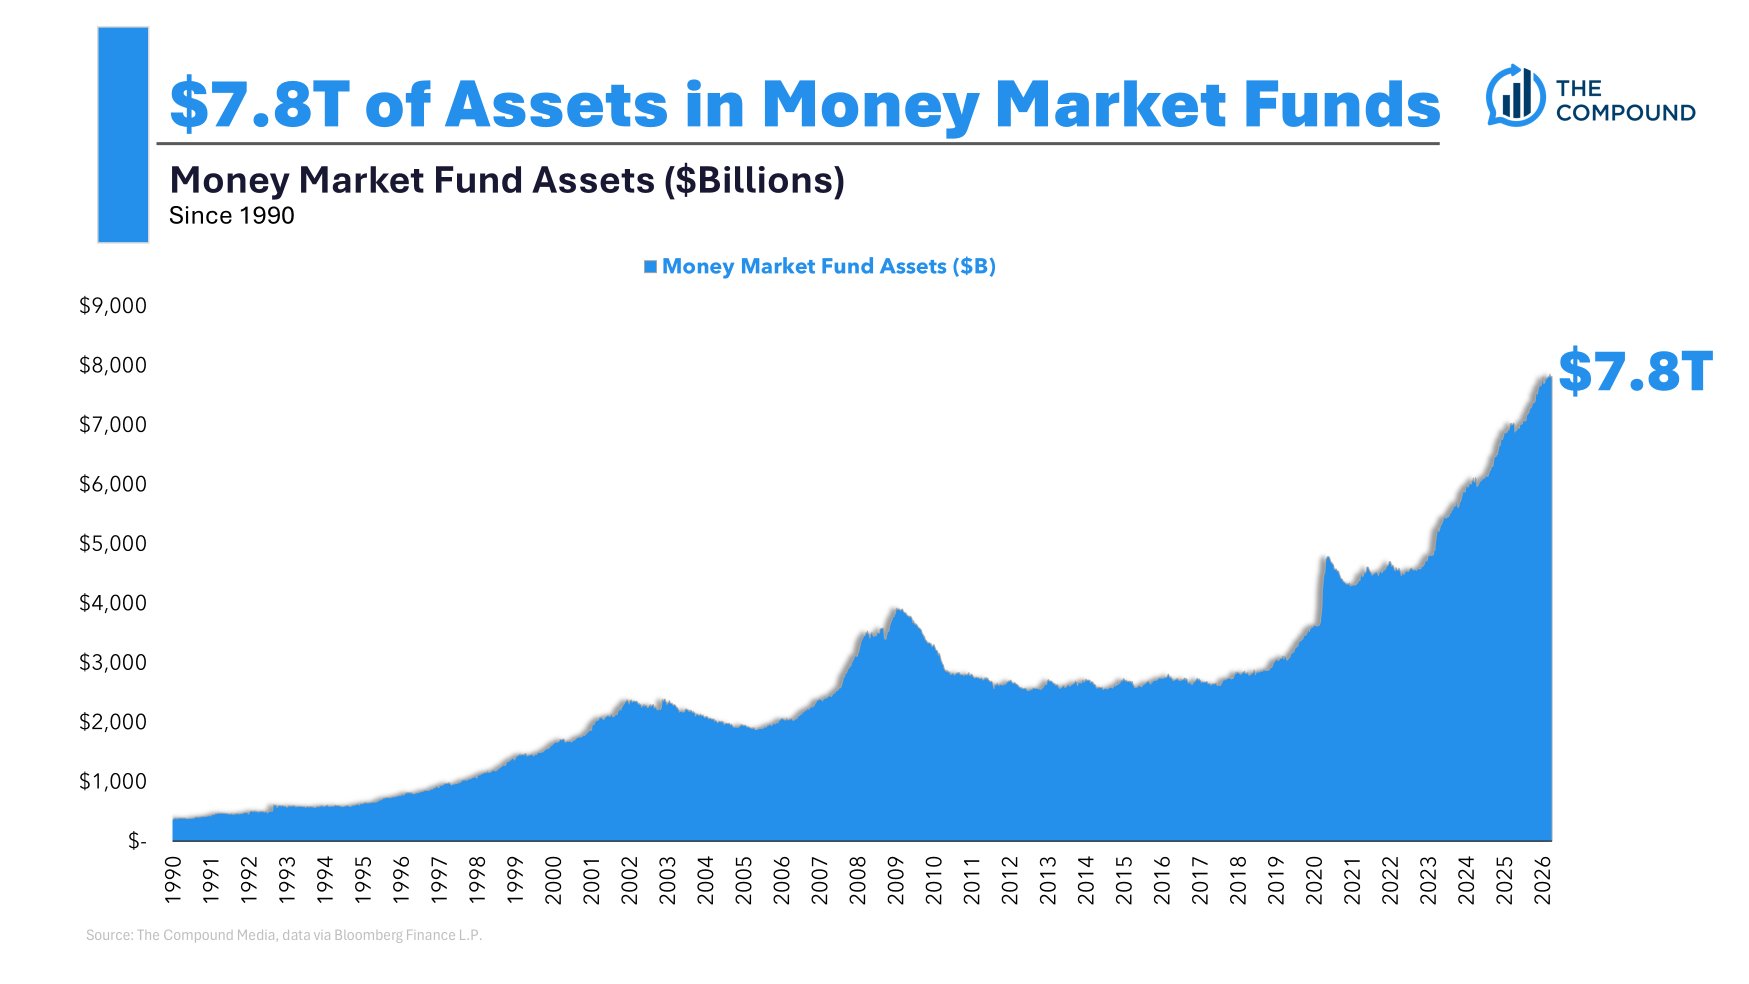
The 2020s have experienced an explosion of wealth.
If you want to know why consumers have been spending like drunken sailors despite everything that’s happened over the past 6 years and change, this is the simplest explanation.
Inflation stings but wages are higher too and assets are way higher.
That’s not to say things are perfect. They never are. The rising tide has lifted most but not all ships.
Delinquencies are rising in credit cards, student loans and auto loans:
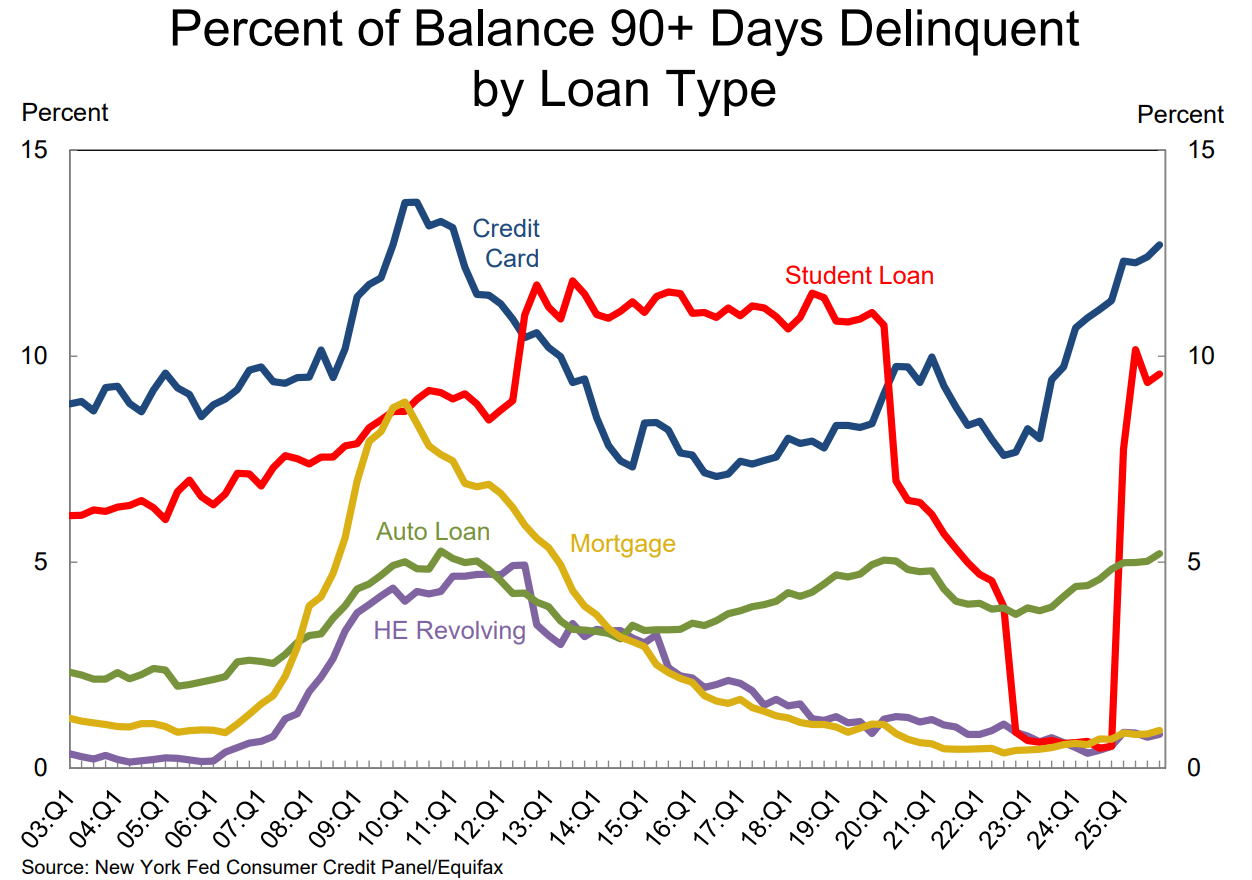
This is worth paying attention to.
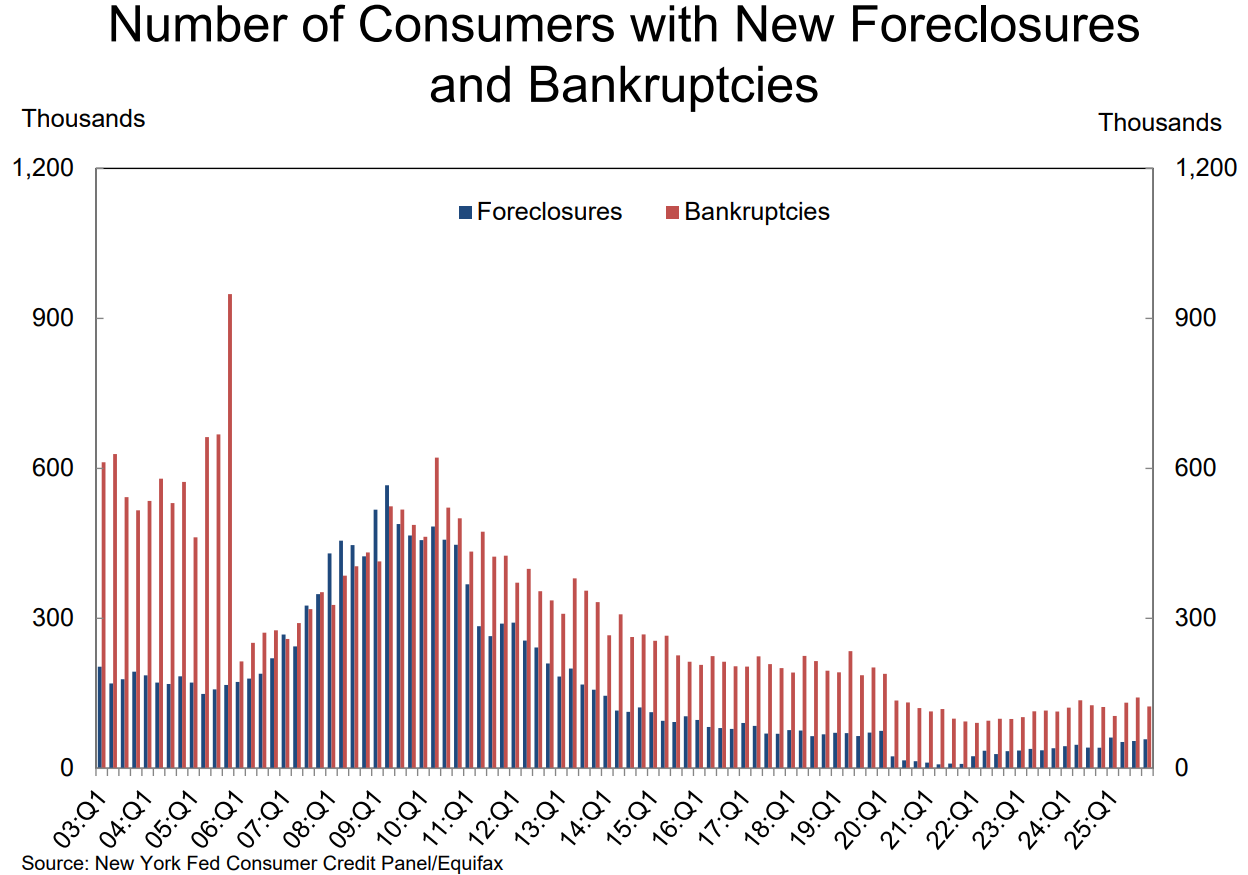
The good news is that the number of households with foreclosures and bankruptcies remains low by historical standards:
Can this continue?
Americans love to spend. We’re good at it.
I guess a lot depends on how financial markets perform and whether the unemployment rate rises meaningfully.
As long as households feel wealthy and have a job, it’s hard to see spending levels slow.
If the markets take a prolonged dive and/or people start losing jobs, this situation could certainly change.
I covered this question on the most recent episode of Ask the Compound:
We also touched on questions about why markets move so much in the short-run, how well your 60/40 portfolio protects against bear markets, how advisors should think about private investments and some lessons learned in wealth management.
Further Reading:
The Longest Economic Boom Ever?
1Remember when the big concern was excess pandemic savings running out? You don’t hear about that anymore.
2Mortgage debt still makes up the biggest liability by far (70% of the total). Auto loans (9%), student loans (9%) and credit card debt (7%) are the other big categories.

