You can always win any argument you want when it comes to the markets by changing your start and end dates.
You can really drive home your point by starting from the peak of a bull market or the bottom of a nasty crash.
It doesn’t seem like it’s even possible to perform any sleight of hand with the current cycle. U.S. large cap growth stocks — specifically tech stocks — have been outperforming everything for years now.
And now that we’re potentially setting up for an AI bubble, tech stocks feel like they are destined to keep it going.
However, I have some performance charts over various time horizons that might surprise you.
Not this one:
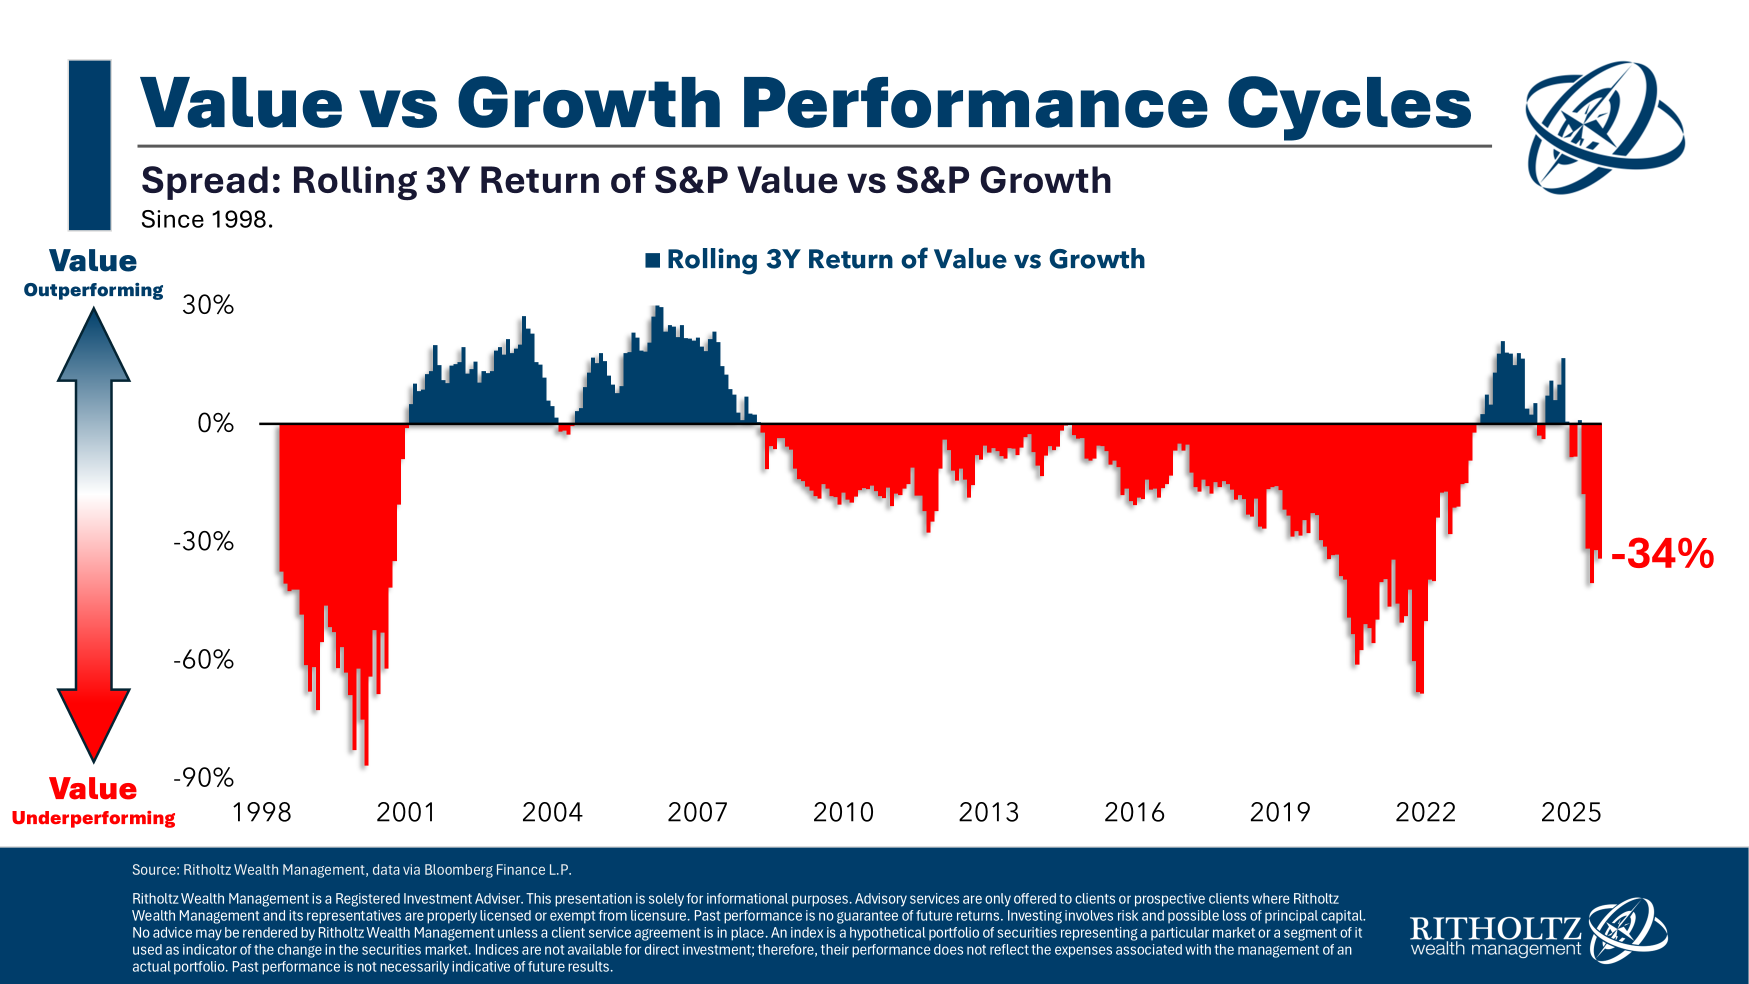
Value investing isn’t necessarily dead, but it has only come alive on occasion over the past 30 years or so.
This might surprise you: small-cap value — both U.S. and international — have outperformed over the past 5 years!
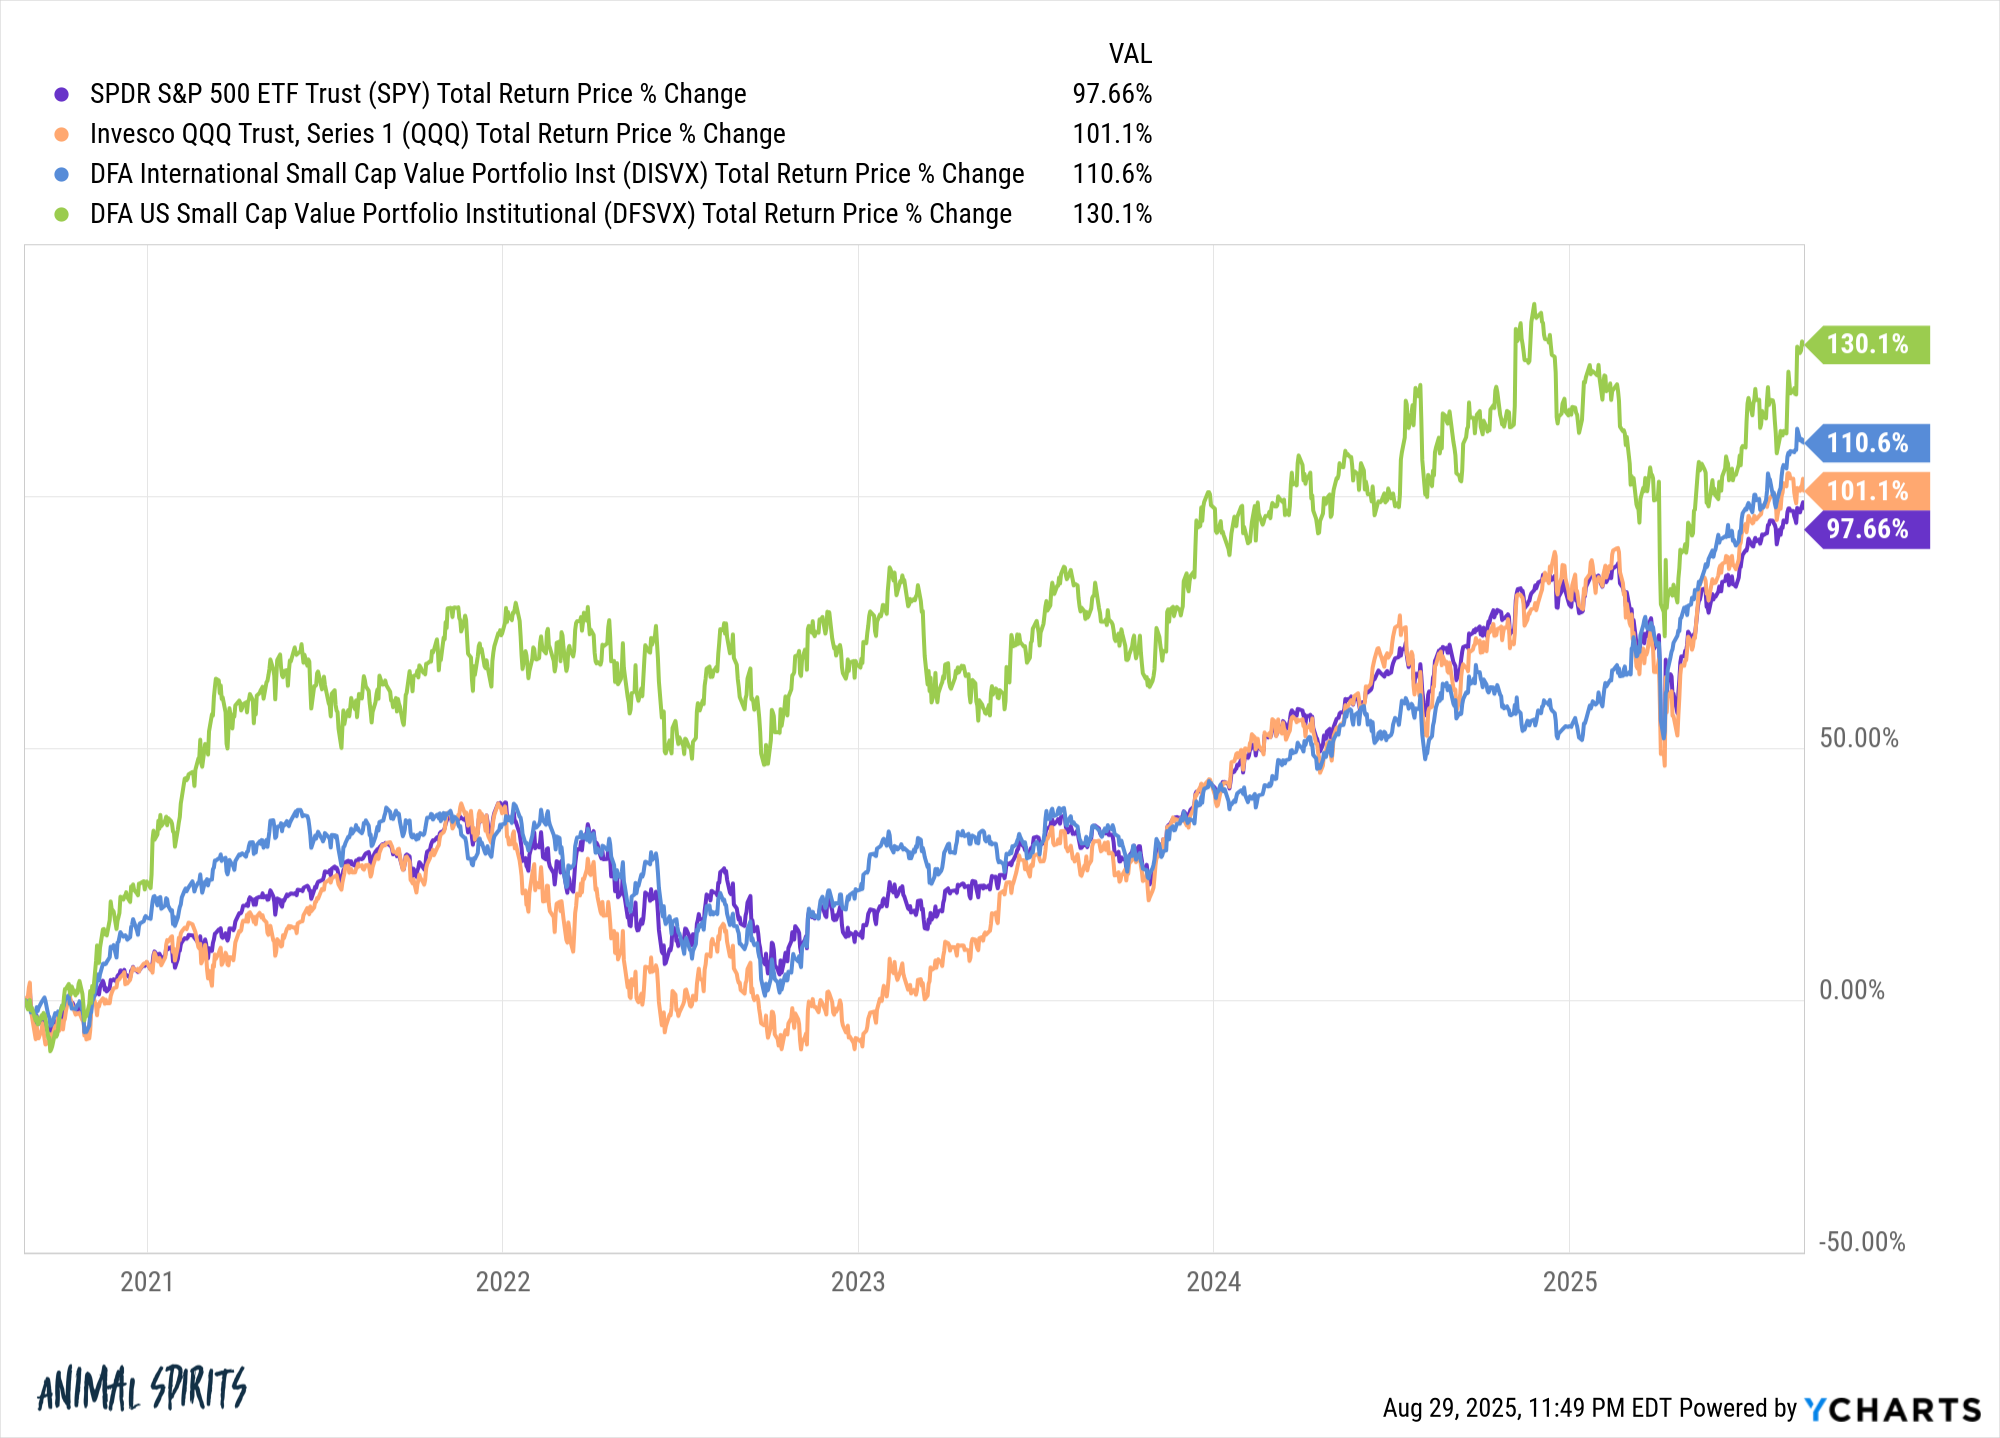
The international piece is the one that’s likely the most shocking here. Who knew?
Small caps have been left for dead as well.
But look at the performance of large caps, mid caps and small caps from the bottom in the mini-bear market from the trade was in April:
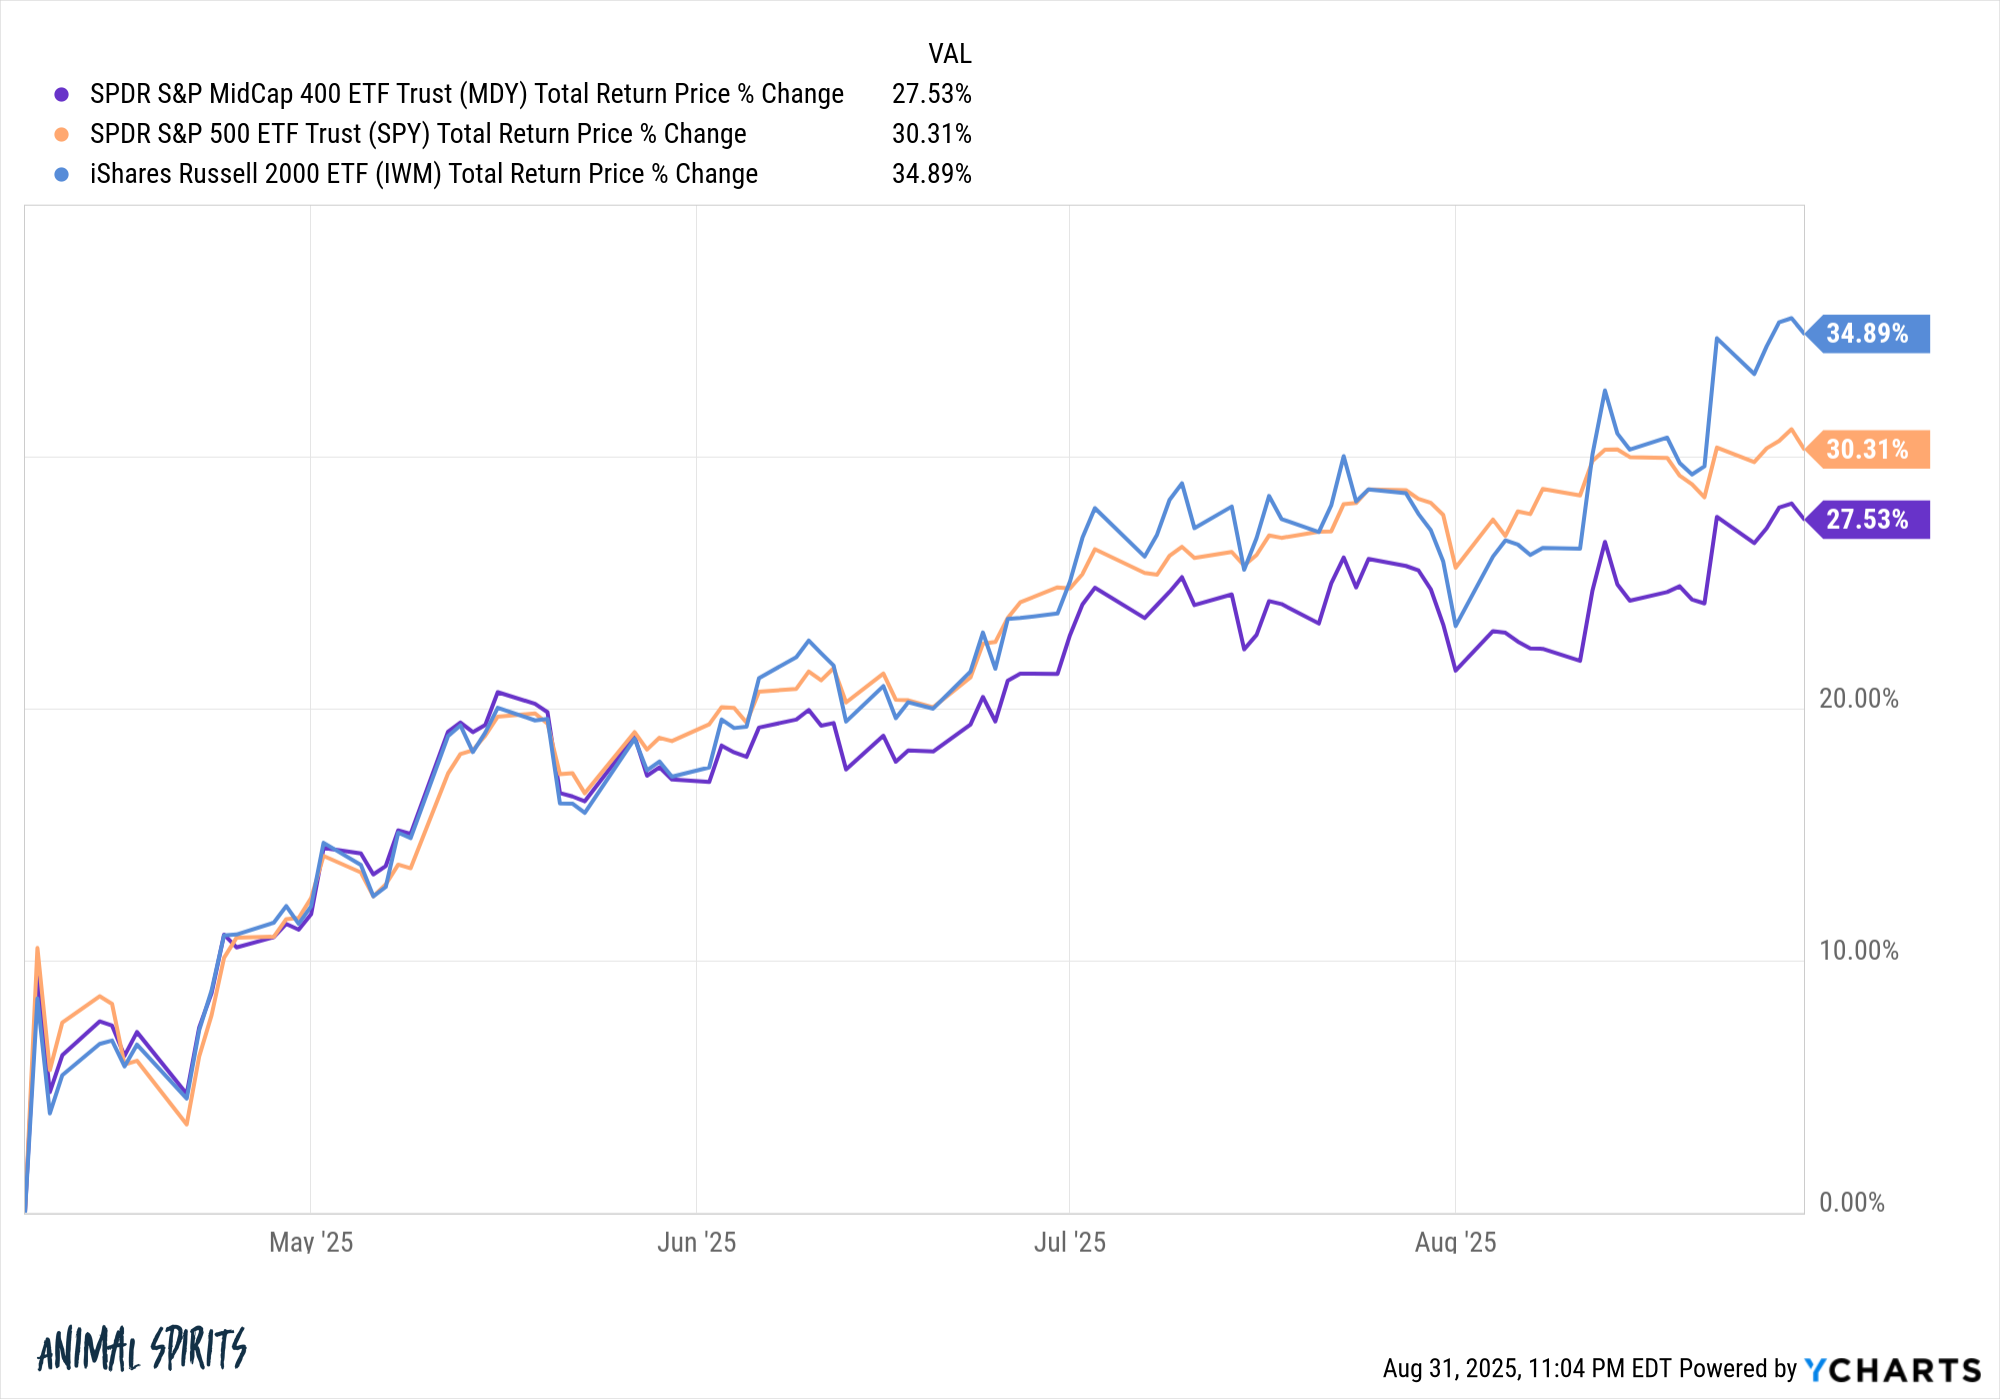
Small caps are outperforming coming off the lows while mid caps are more or less keeping up with the S&P 500.
This is far too short a time frame to draw any conclusions but it’s interesting to think through some possibilities here. The tech behemoths are spending an insane amount of money on capex to make AI happen.
Let’s say all of the AI productivity gains come to fruition. Maybe the small and mid-sized companies will benefit without having to spend nearly as much at the mega cap stocks?
It’s worth considering.
Here’s another one that almost doesn’t seem real:
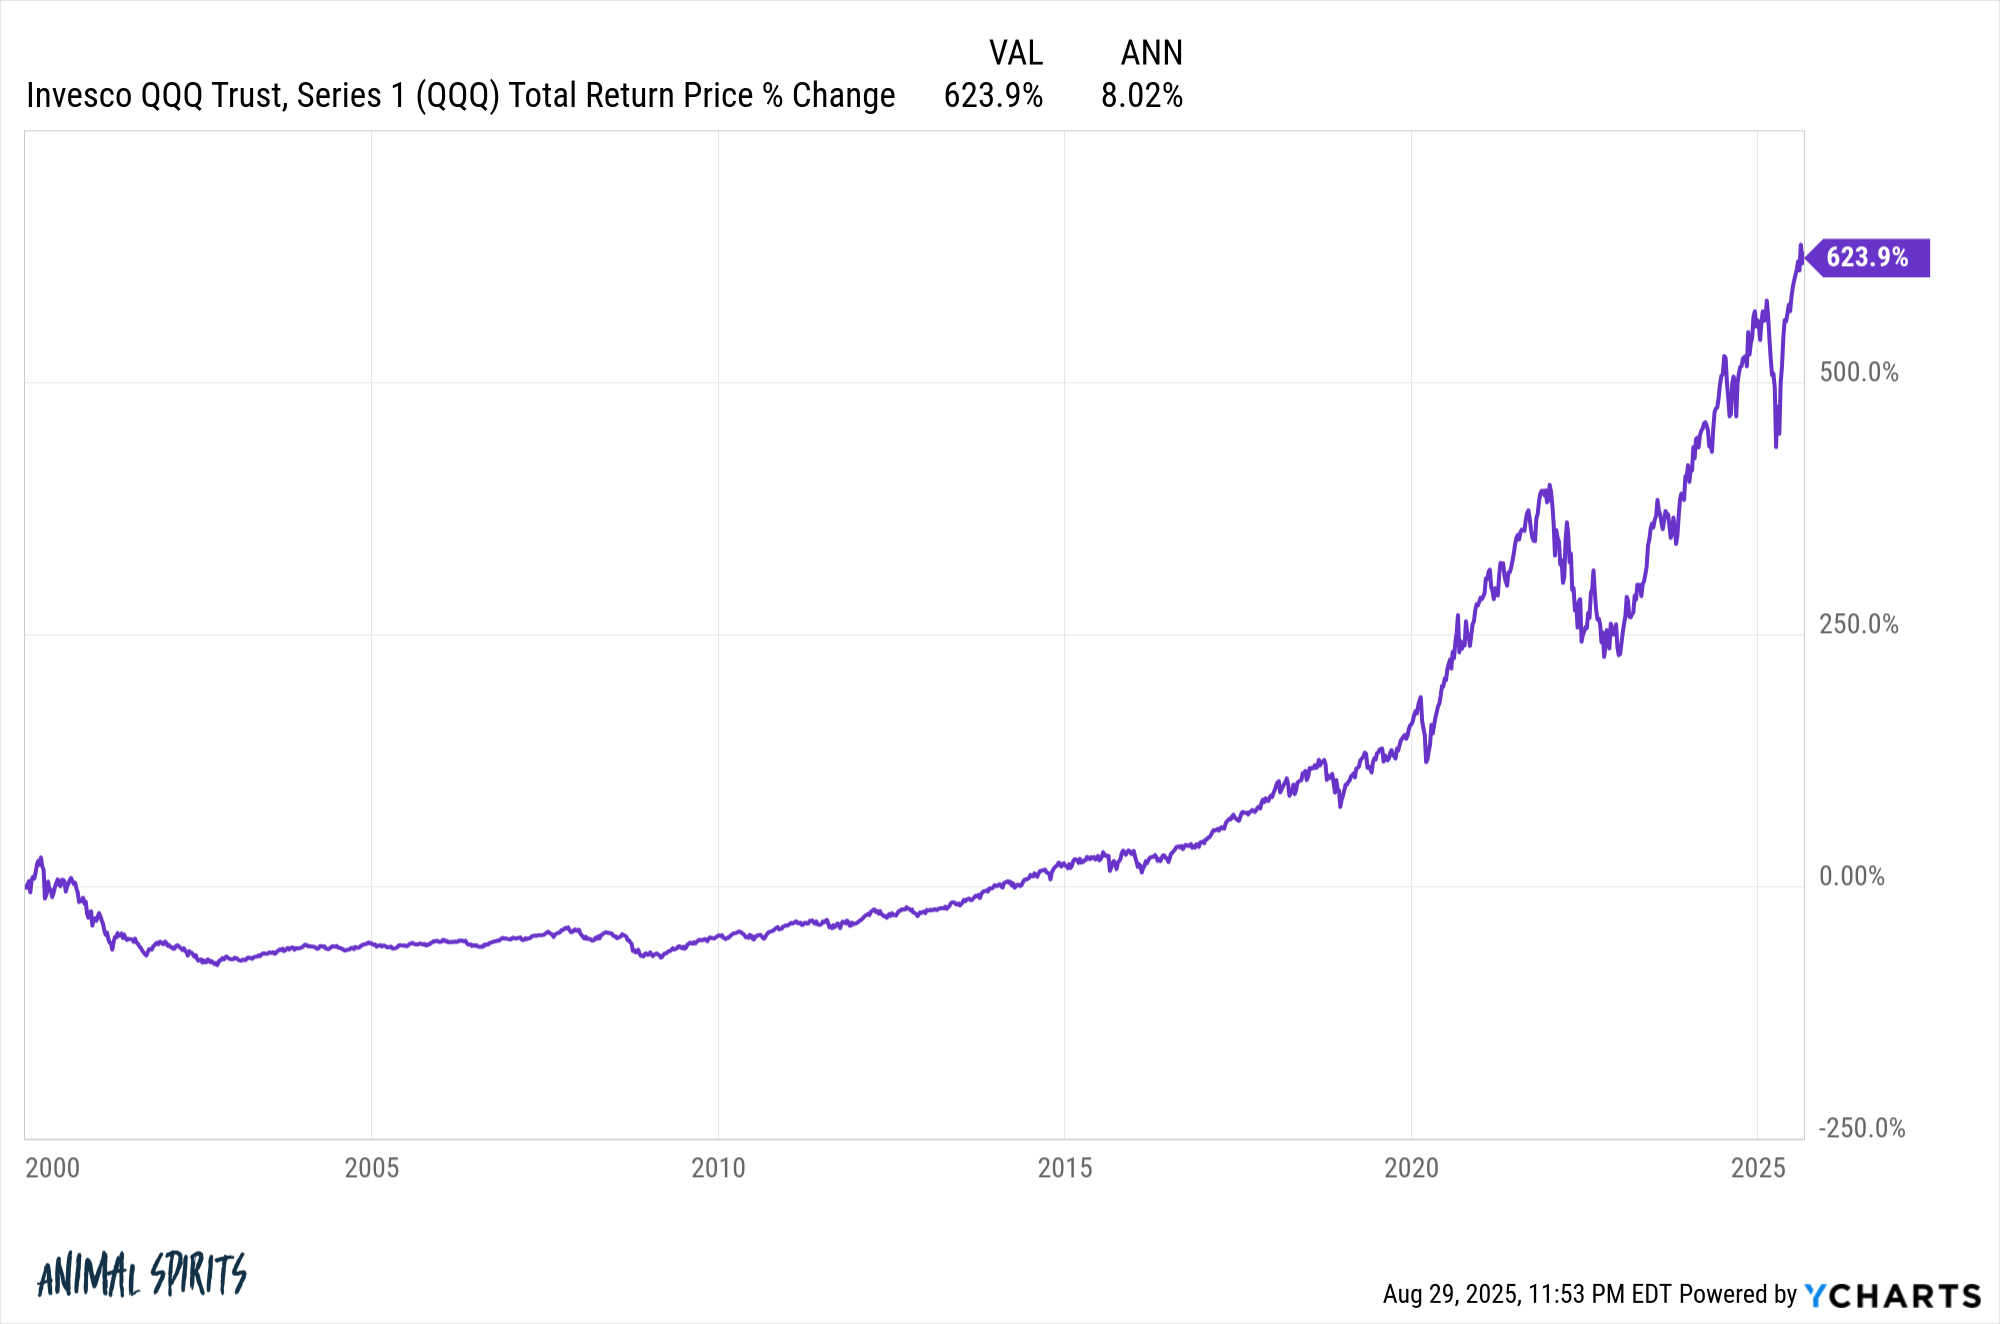
The Nasdaq 100 has compounded at just 8% per year this century.
That doesn’t seem to compute given the fact that the Qs have returned nearly 20% per year since the start of 2013.
So where does the 8% figure come from?
That’s because the total return for the Nasdaq 100 from 2000-2012 was -28.7% or an annual return of -2.3%. It was a lost decade and then some. This awful period included a gargantuan drawdown of 83% following the bursting of the dot-com bubble.
Starting from the peak of the dot-com bubble almost doesn’t seem fair but combining a massive bear market with a massive bull market tends to result in average-ish results.
Here’s another 21st century chart that might surprise you:
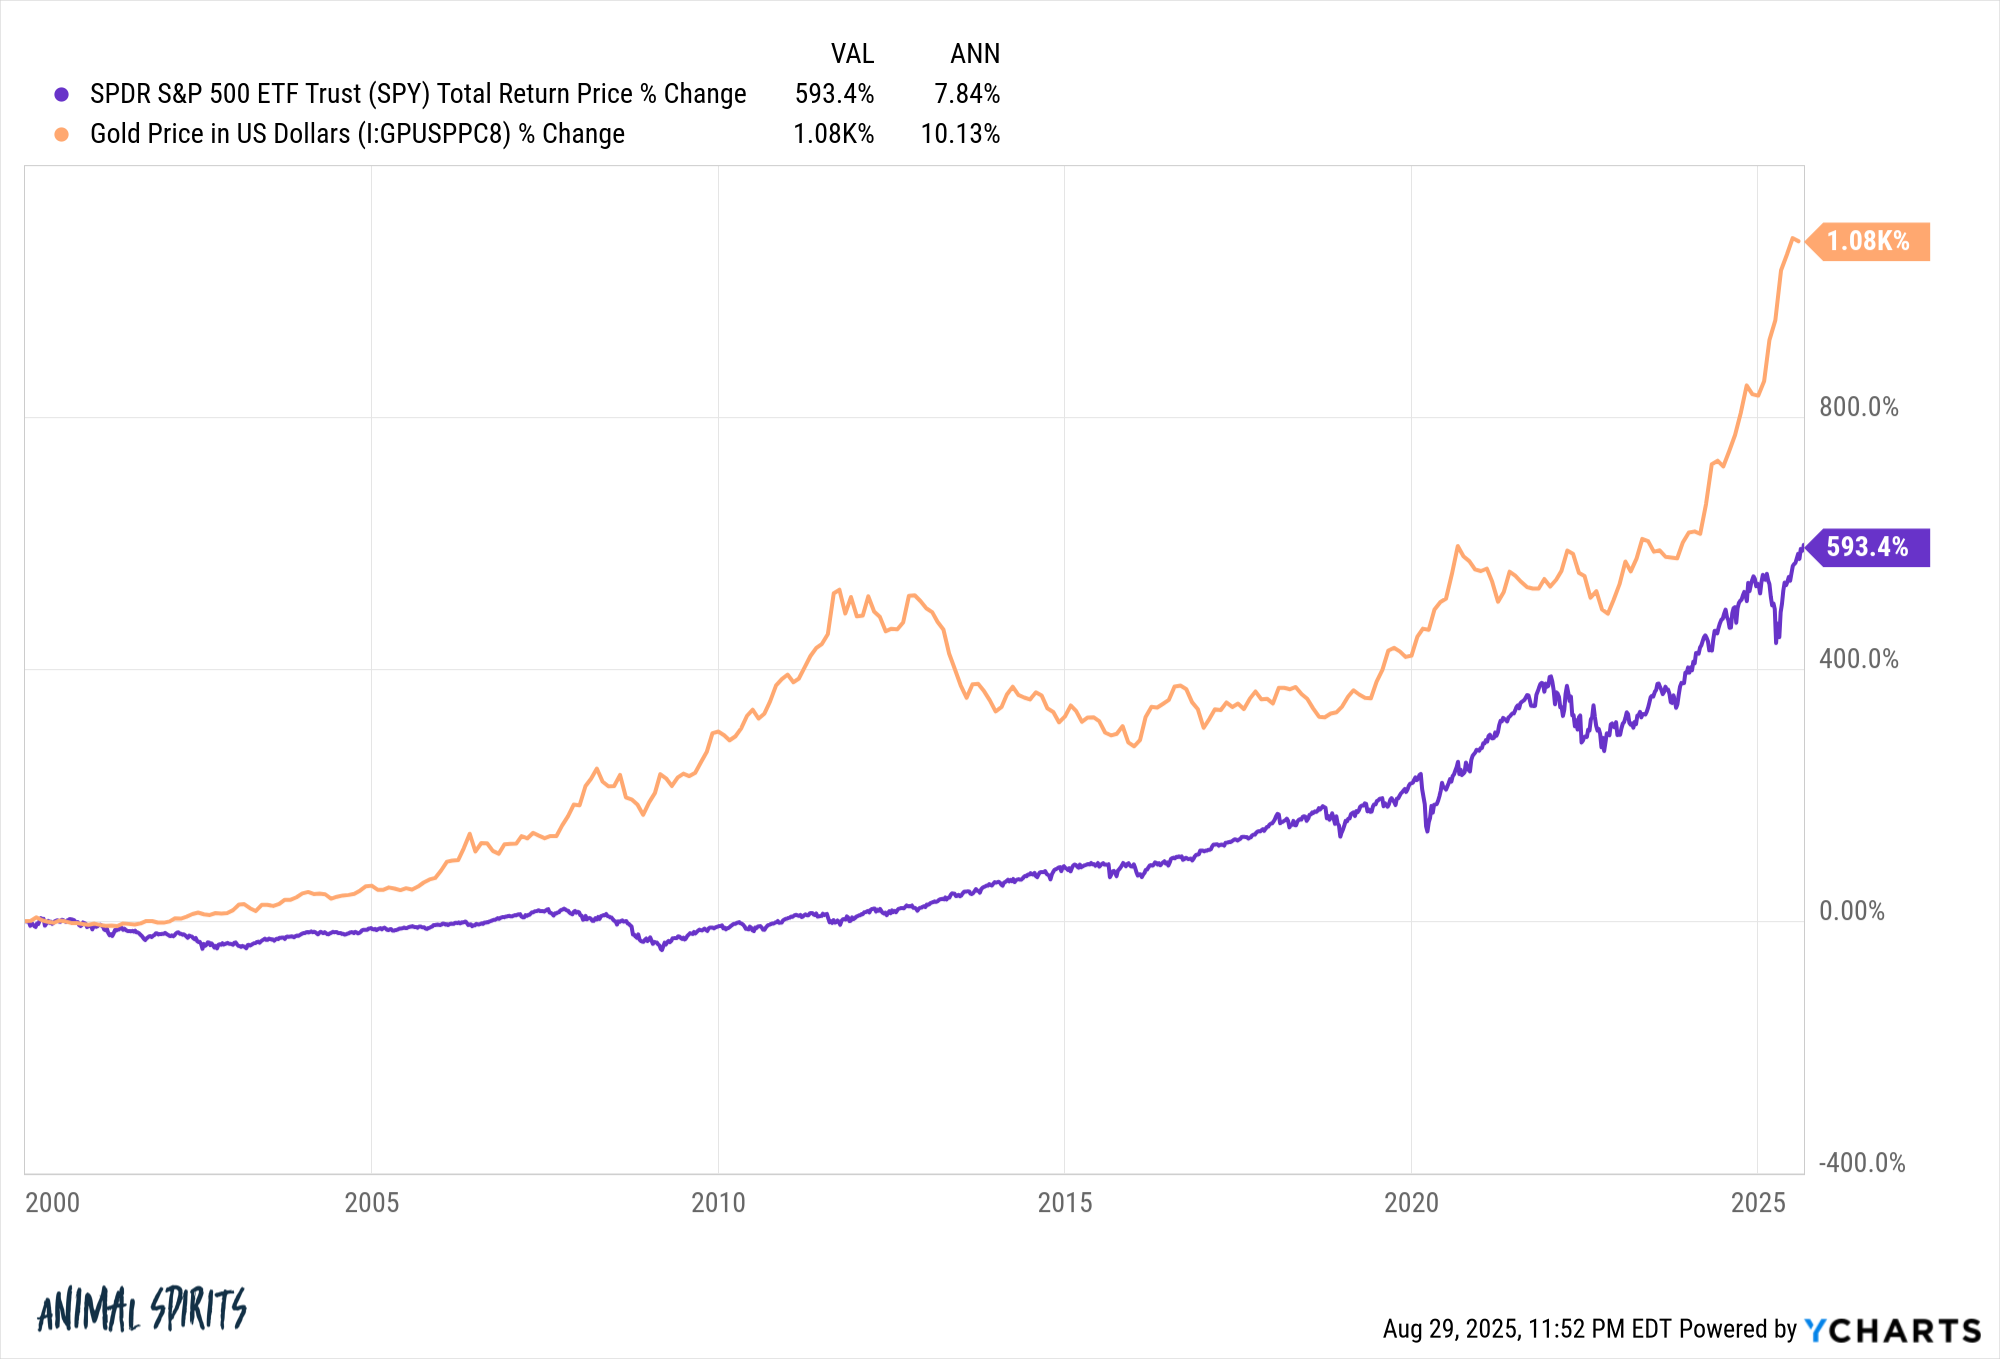
Gold is handily outperforming the S&P 500 since 2000.
To be fair, gold was coming off a two-decade-long bear market while the S&P 500 was coming off a two-decade-long bull market. Timing, as they say, is everything.
Here’s one no one would have predicted coming into this year:
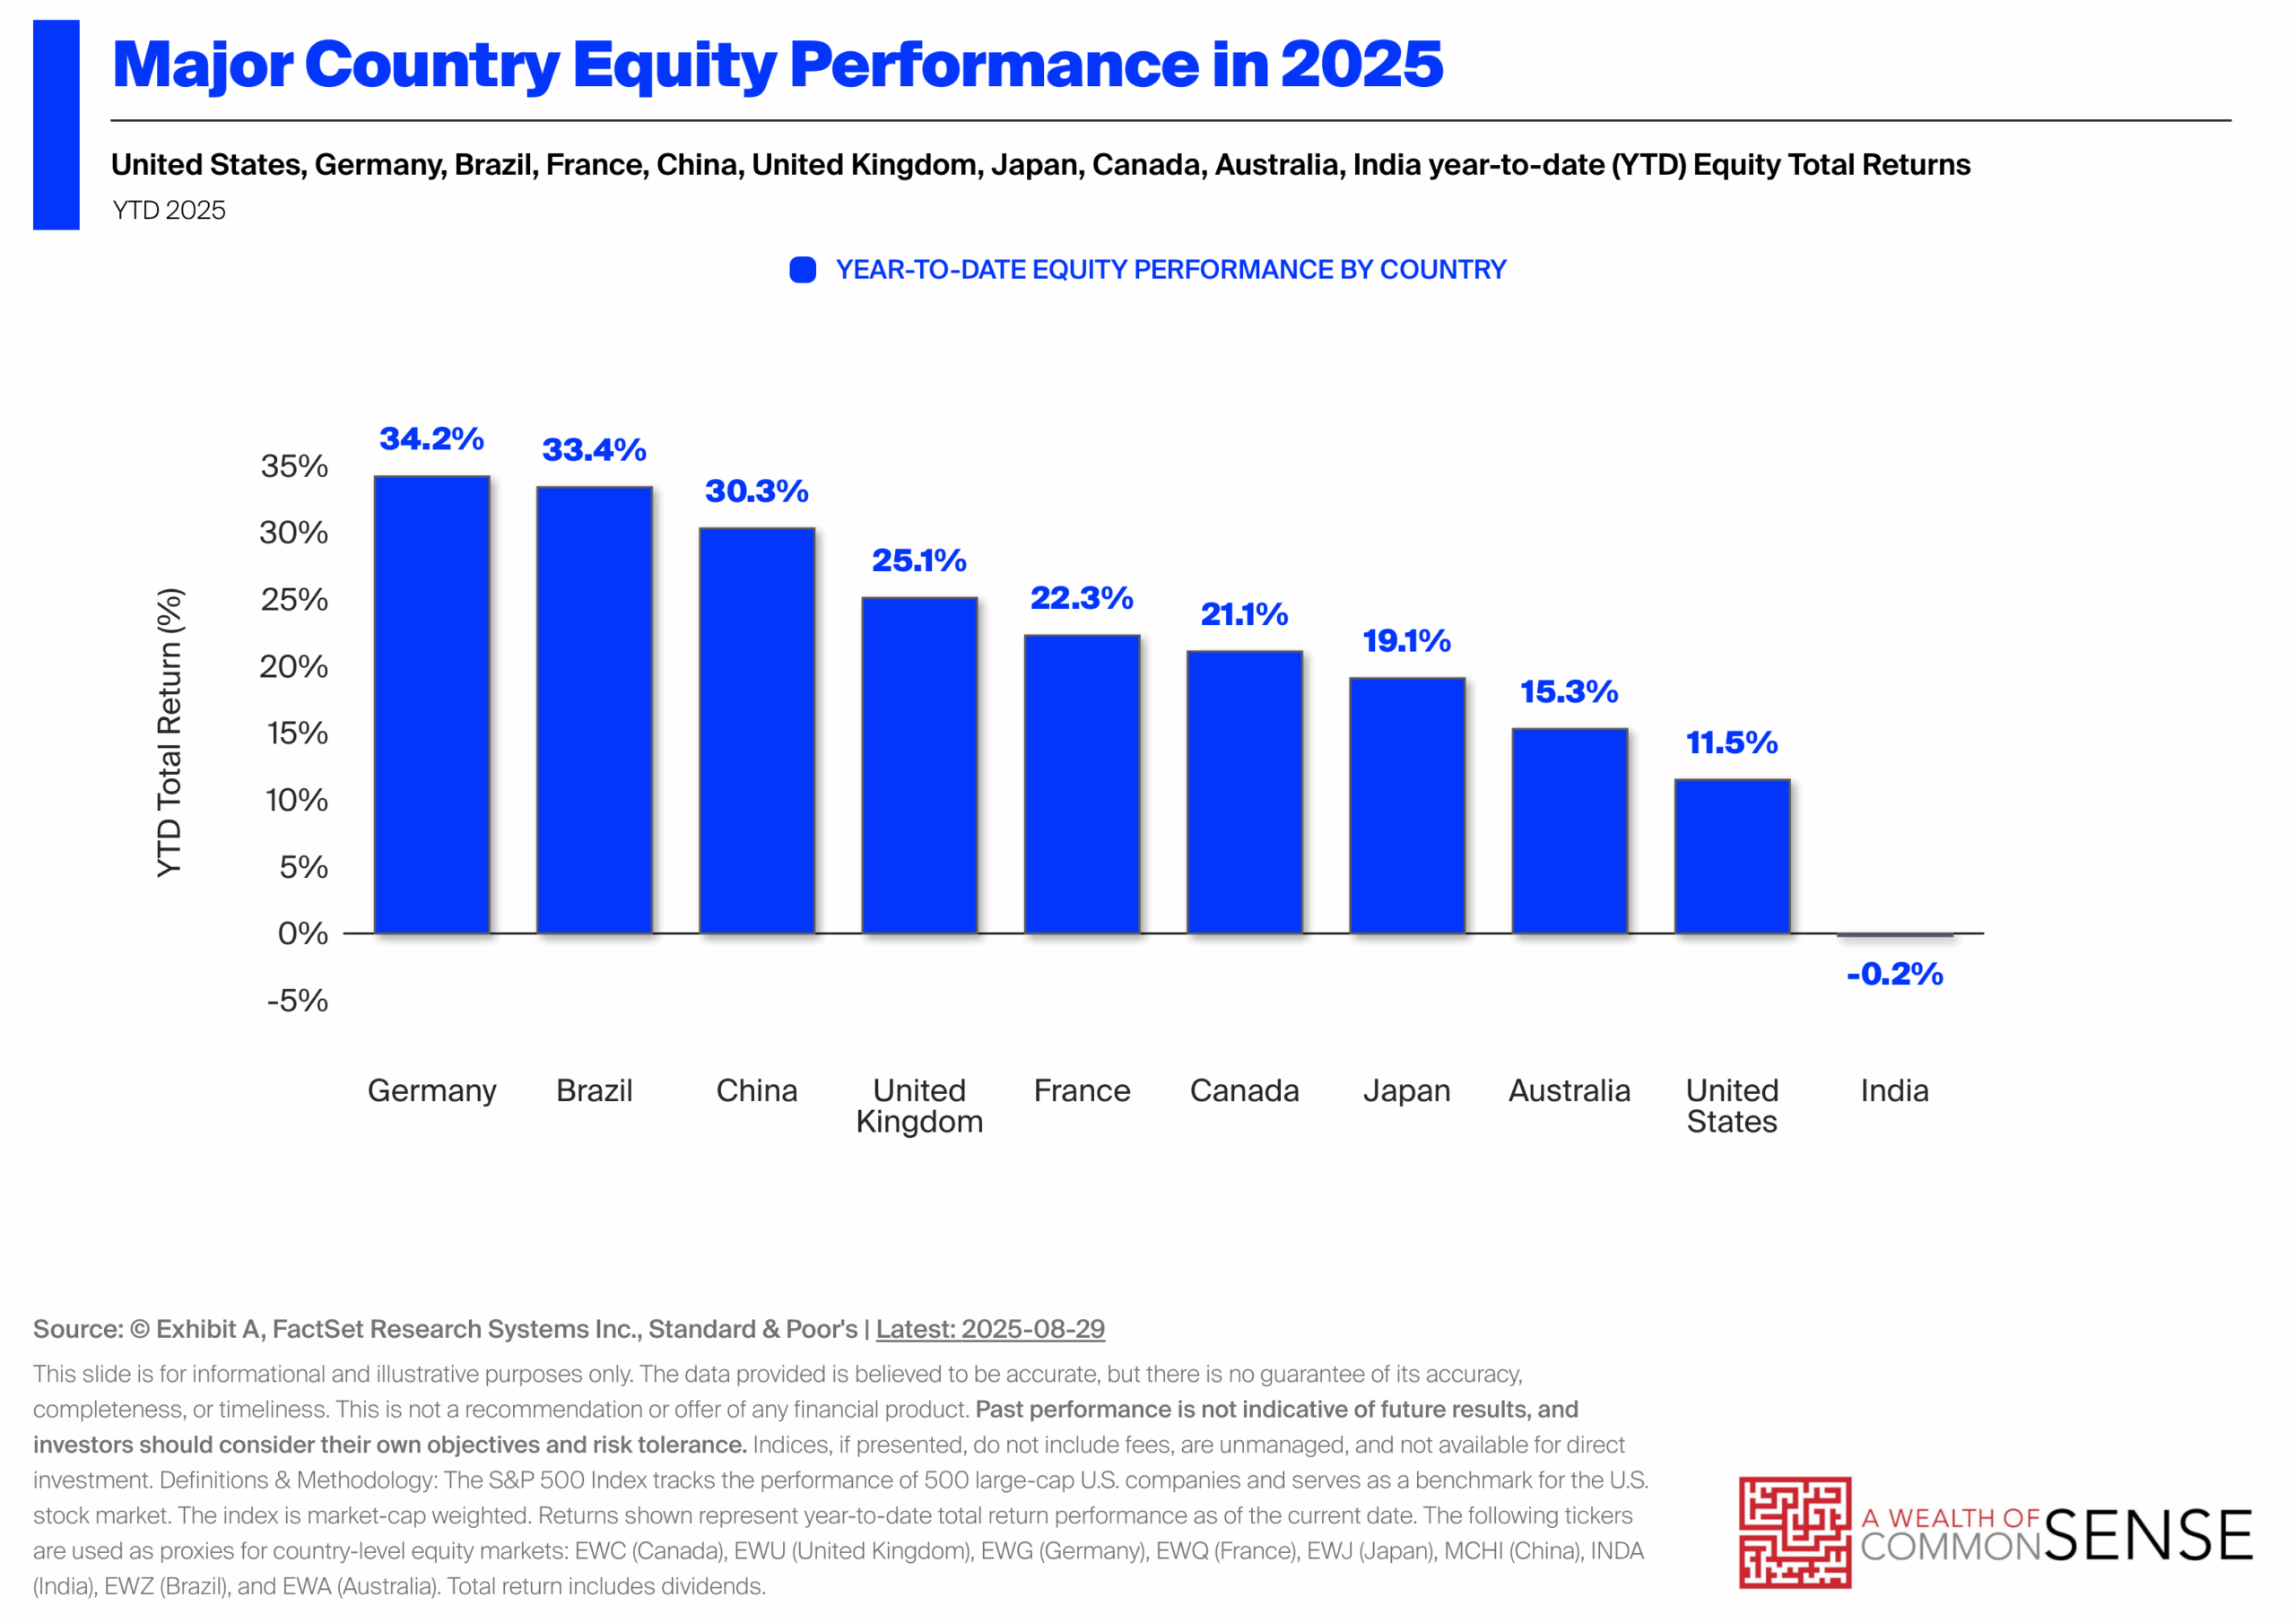
Almost every other country with a decent-sized economy is outperforming the U.S. stock market in 2025.
The good news is that there are no investors who time these things perfectly. No one invests at the bottom or gets out of the top every time.
No one consistently picks the best asset classes or avoids the worst.
That’s an impossible strategy.
Managing risk requires some combination of diversification or an iron will to stick with your chosen strategy come hell or high water.
I prefer diversification, warts and all.
Further Reading:
How to Win Any Argument About the Stock Market

