A reader asks a follow-up to a previous blog post:
Do you have an inverse chart that shows what bonds do when the market goes up (which happens much more than it falls)?
Recently, I looked at the historical performance of bonds when stocks go down:
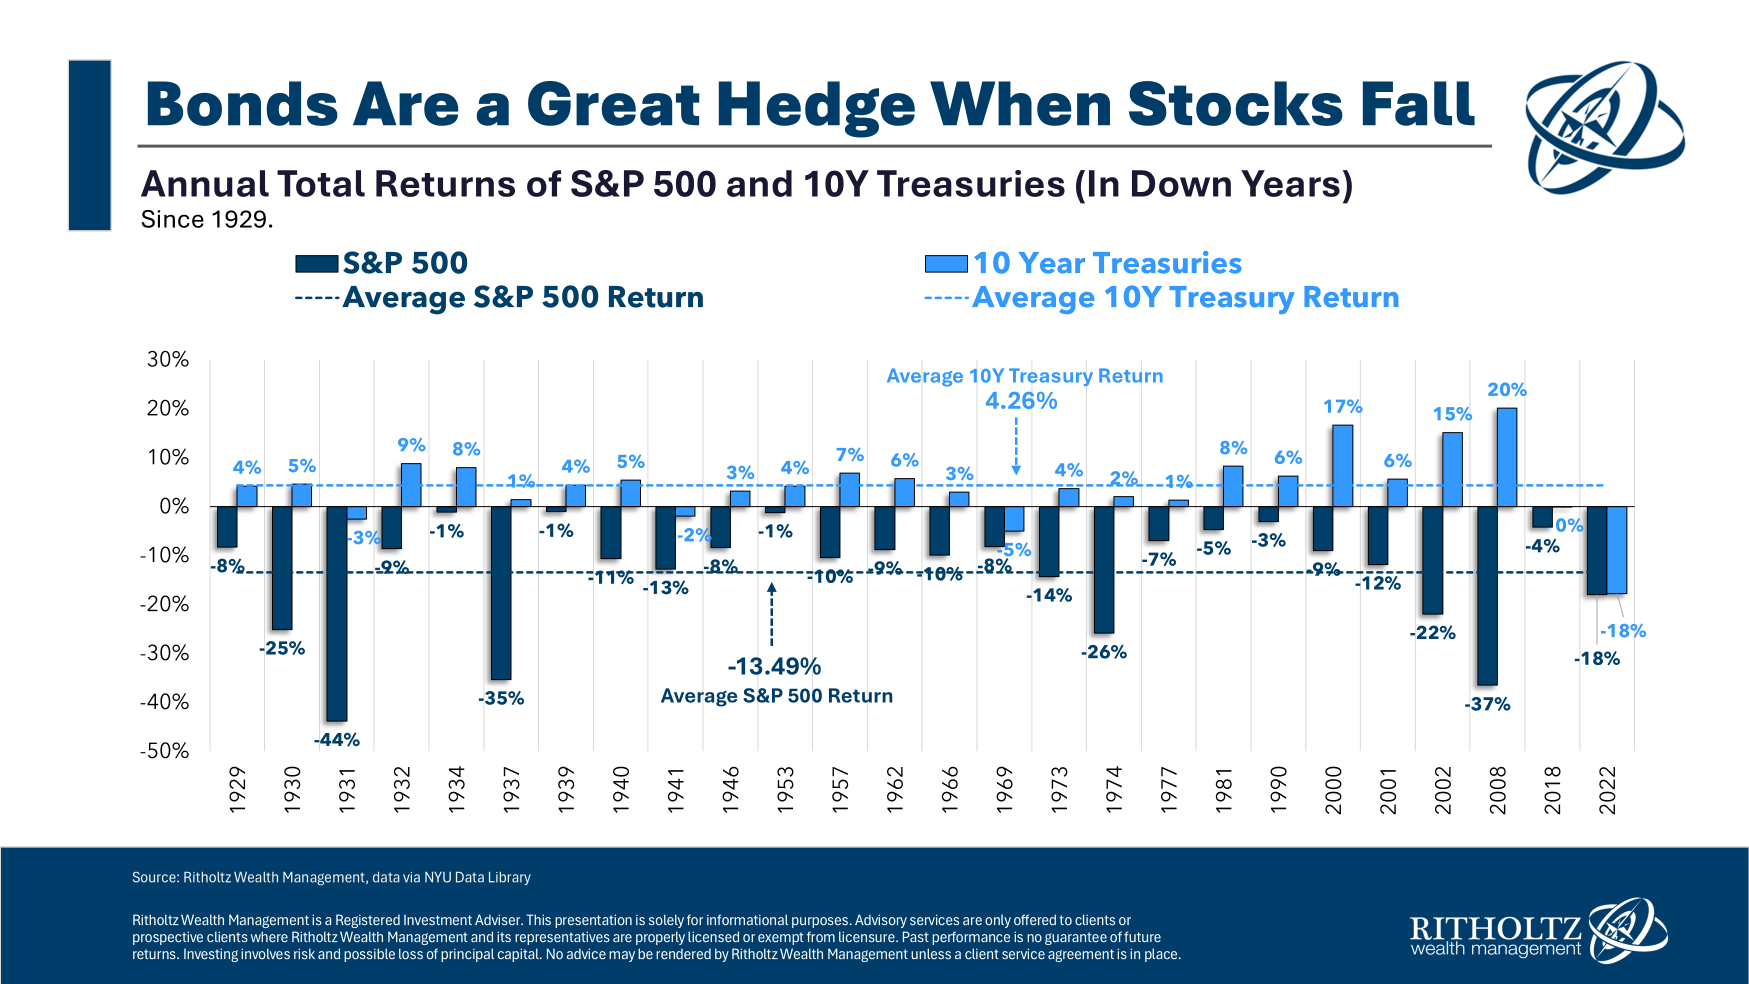
In summary, most of the time when stocks go down, bonds go up…but not all the time.
High-quality bonds are a pretty good hedge against bad years in the stock market.
I’ve never actually looked at the other side of this before — how do bonds perform when the stock market goes up?
Here’s a look at every positive year for the S&P 500 along with the corresponding return for 10 year Treasuries going back to 1928:
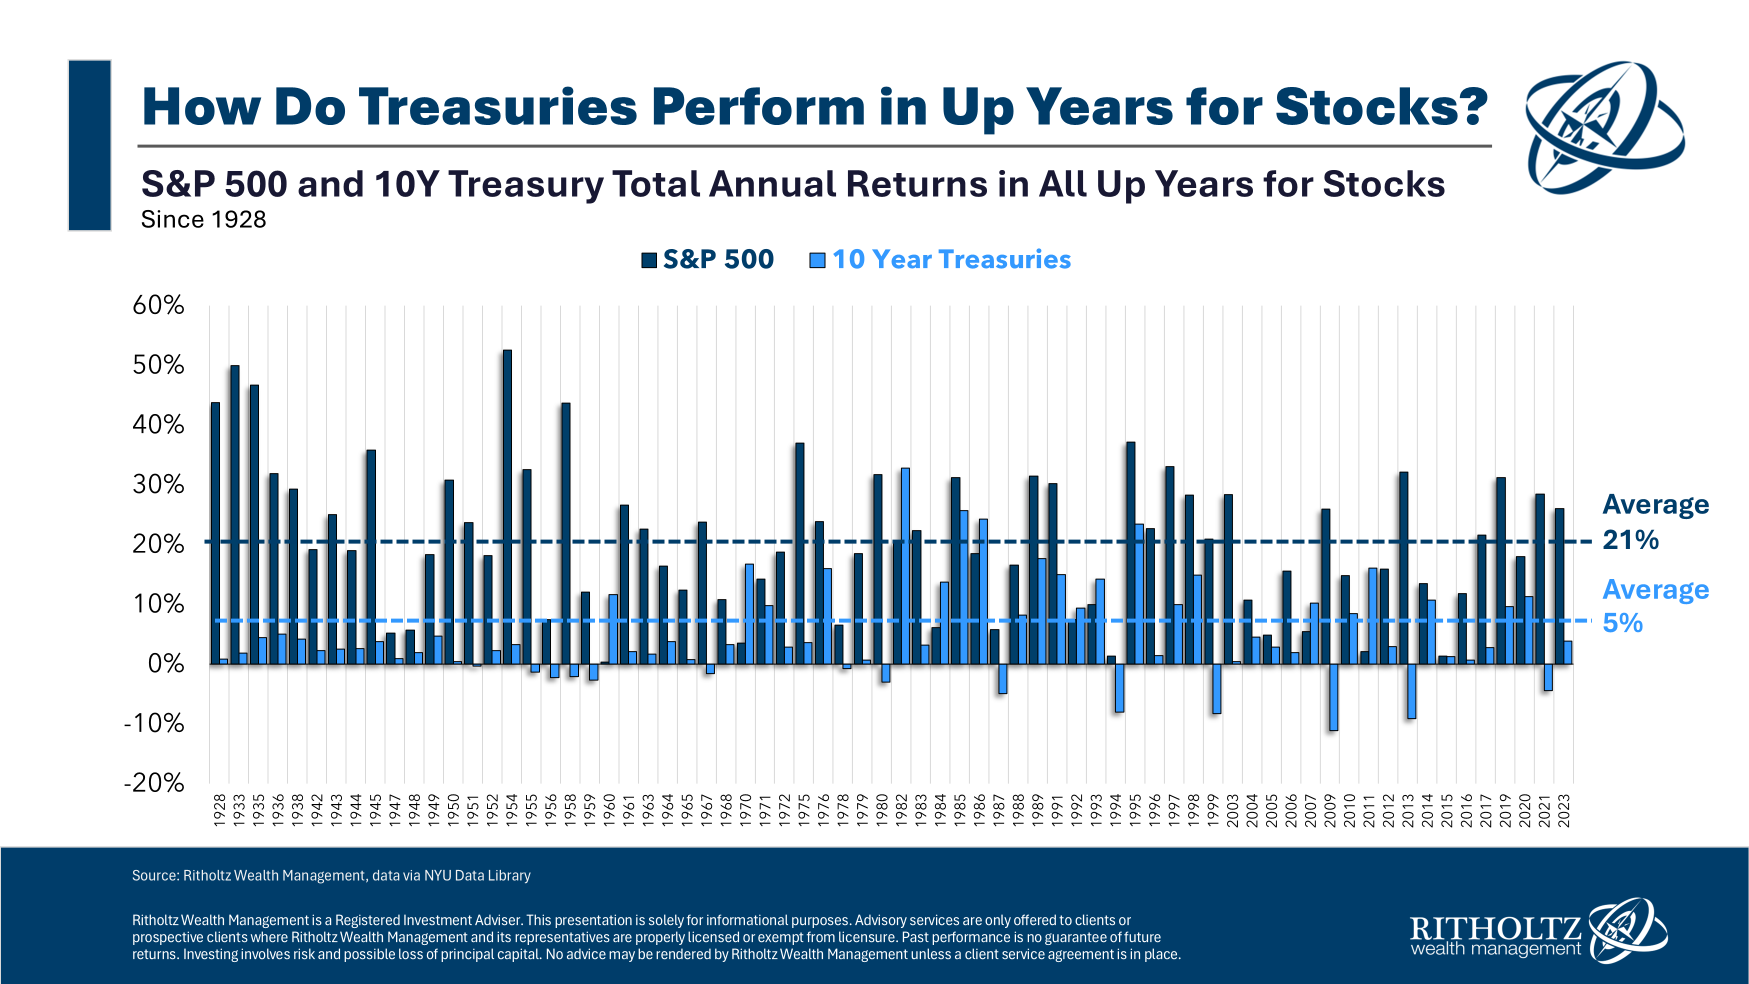
Some investors mistakenly assume stocks and bonds are negatively correlated, meaning that when stocks rise, bonds fall and when stocks fall, bonds rise.
But bonds have done just fine during up years for the stock market.
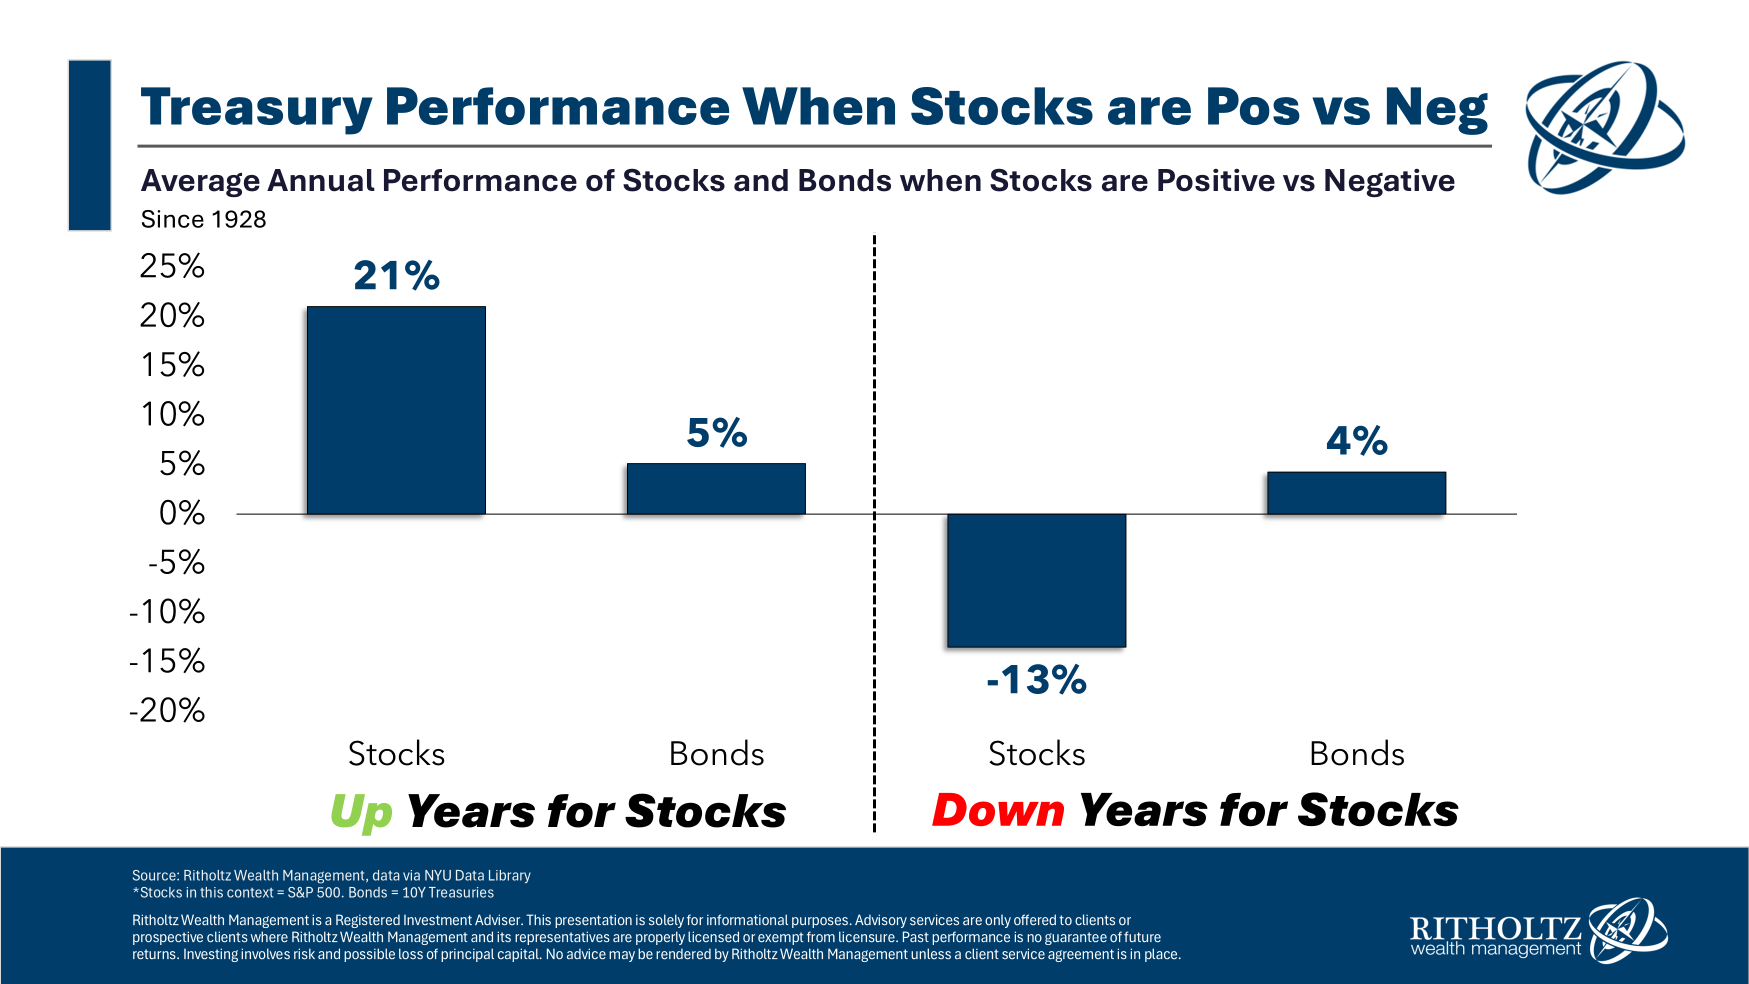
In fact, the average returns for 10 year Treasuries have been higher during up years than down years:
Bonds are obviously far more stable than the stock market. The distributions of bond gains and losses were similar during stock market upswing and downturns.
When the S&P 500 was positive bonds had a negative return 20% of the time (meaning 80% positive results).
When the S&P 500 was negative bonds had a negative return 19% of the time (meaning 81% positive results).
The average returns were similar and the win/loss rates were similar.
What does this tell us?
Bonds are a pretty good diversifier.
Of course, there are market environments where bond and stock correlations can be harmful to a portfolio. The most recent example was 2022 when both stocks and bonds fell in a rising rate/inflation environment.
Diversification works most of the time but not all of the time.
It’s also interesting to note the average gains and losses for the stocks and bonds market.
The average up year for the stock market was a gain of more than 20% while the average down year was a loss of more than 13%. For bonds, the average up year was +7.1% while the average down year was a loss of -4.9%.
Bonds were also positive on the whole in more years than stocks.
From 1928-2023, 10 year Treasuries finished the year with a gain 80% of the time while the stock market was up in 73% of all years during that period.
These numbers offer a good explanation of the risk premium inherent in the stock market. The stock market earned more than double the annual return over bonds in the 96 year period from 1928 through 2023 partly because there is more risk involved when owning stocks.1
The gains are bigger in the stock market but so are the losses.
You can’t earn a risk premium without taking some risk.
The good news for diversified investors is there can be a time and a place for both asset classes.
Stocks and bonds both finished the year with gains simultaneously nearly 60% of the time. Bonds finished the year higher than stocks 36% of all years.
The stock market wins over the long run but that’s not always the case in the short run.
Bonds are up most of the time, whether stocks are up or down.
Not perfect, but fixed income remains one of the simplest stock market hedges there is.
We covered this question on the latest edition of Ask the Compound:
My colleague Alex Palumbo joined us on the show this week to discuss questions about how to deploy a big chunk of cash savings, how to diversify out of company stock, benchmarking financial performance and how to think about alpha when it comes to choosing a financial advisor.
Further Reading:
The Holy Grail of Portfolio Management
1The S&P 500 was up 9.8% per year while the 10 year Treasury gained 4.6% annually from 1928-2023.
