The firehose of information we’re afforded these days is a double-edged sword.
There is an abundance of news, analysis, charts and opinions but it can all be overwhelming if you don’t have an effective filter in place.
When it comes to finance I have some filters to help understand which types of sources and people to safely ignore.
These are the types of financial voices and data I immediately ignore:
Pricing the stock market in gold (or some other variable that makes no sense). Seriously, what’s the point of this:
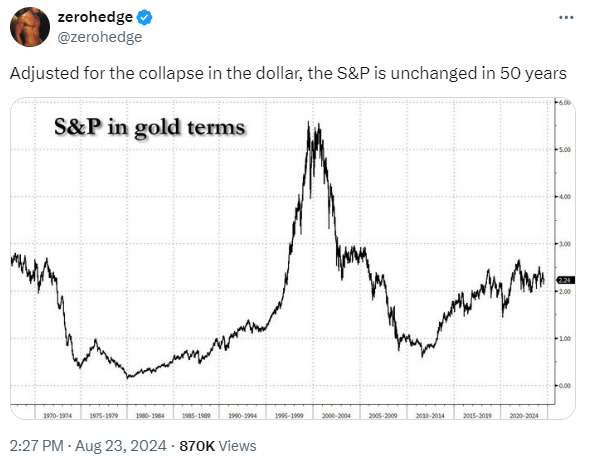
Do people invest in mutual funds and ETFs priced in gold? Of course not!
This is the kind of chart you use when you’ve run out of ways to scare people out of the market.
Honestly, if you listen to Zero Hedge you get what you deserve. The site was started in January 2009, three months before one of the biggest bull markets in history would begin.
That site has probably lost more people money than anyone other than Michael Lewis since the Great Financial Crisis.1
Using price returns instead of total returns. What else was wrong with that gold chart? It was price-only and didn’t include dividends to show total return.
Over the long-run that makes a huge difference.
Since 1950, on a price-only basis, the S&P 500 is up roughly 8% per year. That’s a return of more than 33,000%.
If you include dividends, the annual return jumps to 11.6% per year. That’s a nice bump, but there’s not a huge difference. However, the total return, including dividends, would be more than 350,000%.
That’s a massive gap!
Here’s another example I see all the time:
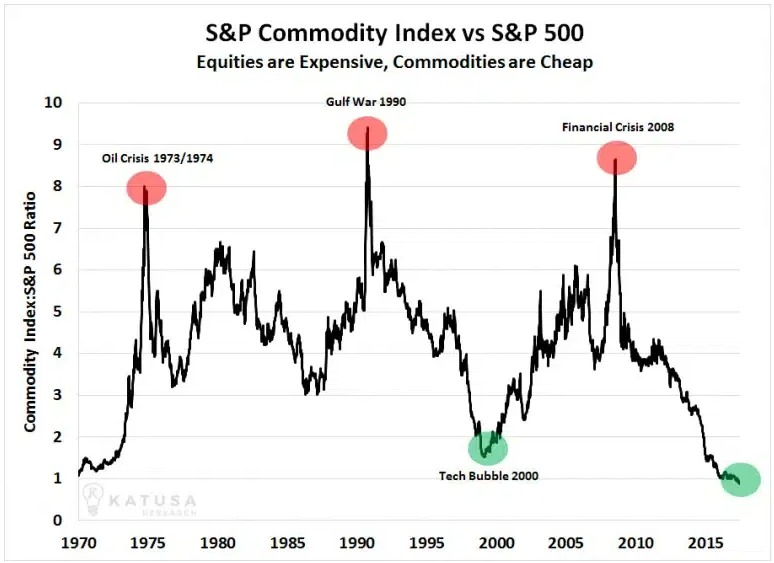
Commodities don’t have cash flows. The stock market does.
You can’t compare the two asset classes on a price-only basis.
It makes no sense.
In the immortal words of defense attorney Vincent Gambini:
People who are political about everything. I understand why there are conservative and liberal economists. But I prefer economists with opinions about economic policies, regardless of political affiliation.
If you look at everything through a partisan lens, I already know exactly what you’re going to say about certain issues.
The same is true about investing.
Everything is more politicized in the age of social media but politics can be toxic to your portfolio if you allow them to skew your views of the markets.
The analog charts. The 1929 analogs are always my favorite:
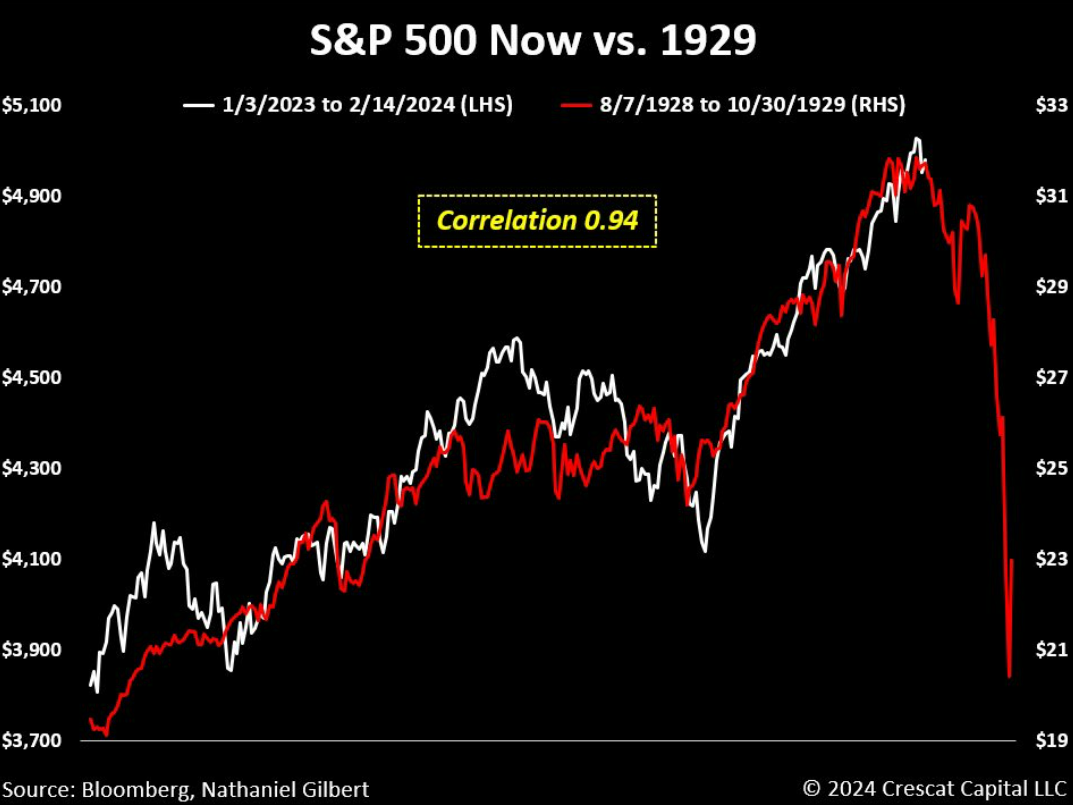
This chart looks just like that chart! Oh no!
I guess you have to give people an A for effort with these but come on!
Permabears & conspiracy theorists. Some might say these people are useful as contrarian indicators but the cranks of the finance world always think the world is falling apart. The financial system is always one Fed misstep away from total and utter collapse.
It’s an echo chamber for people who enjoy losing money.
This one is an easy stay-away.
Guys in a bow tie. A bowtie always makes someone sound 20% smarter. I’m only half kidding.
But just to be safe…
People hung up on a prior crisis. The inflation of the 1970s. The 1987 crash. The bursting of the dot-com bubble. The Great Financial Crisis. Some people still harken back to the 1929 crash.
Understanding financial market history, from booms to busts and everything in between is important. However, certain people continually use past crises to frame the present situation.
Every market correction is not the next Lehman moment.
The fiat/dollar people. Fed-haters love to use this chart showing the value of a dollar since 1913 (when the Fed was created):
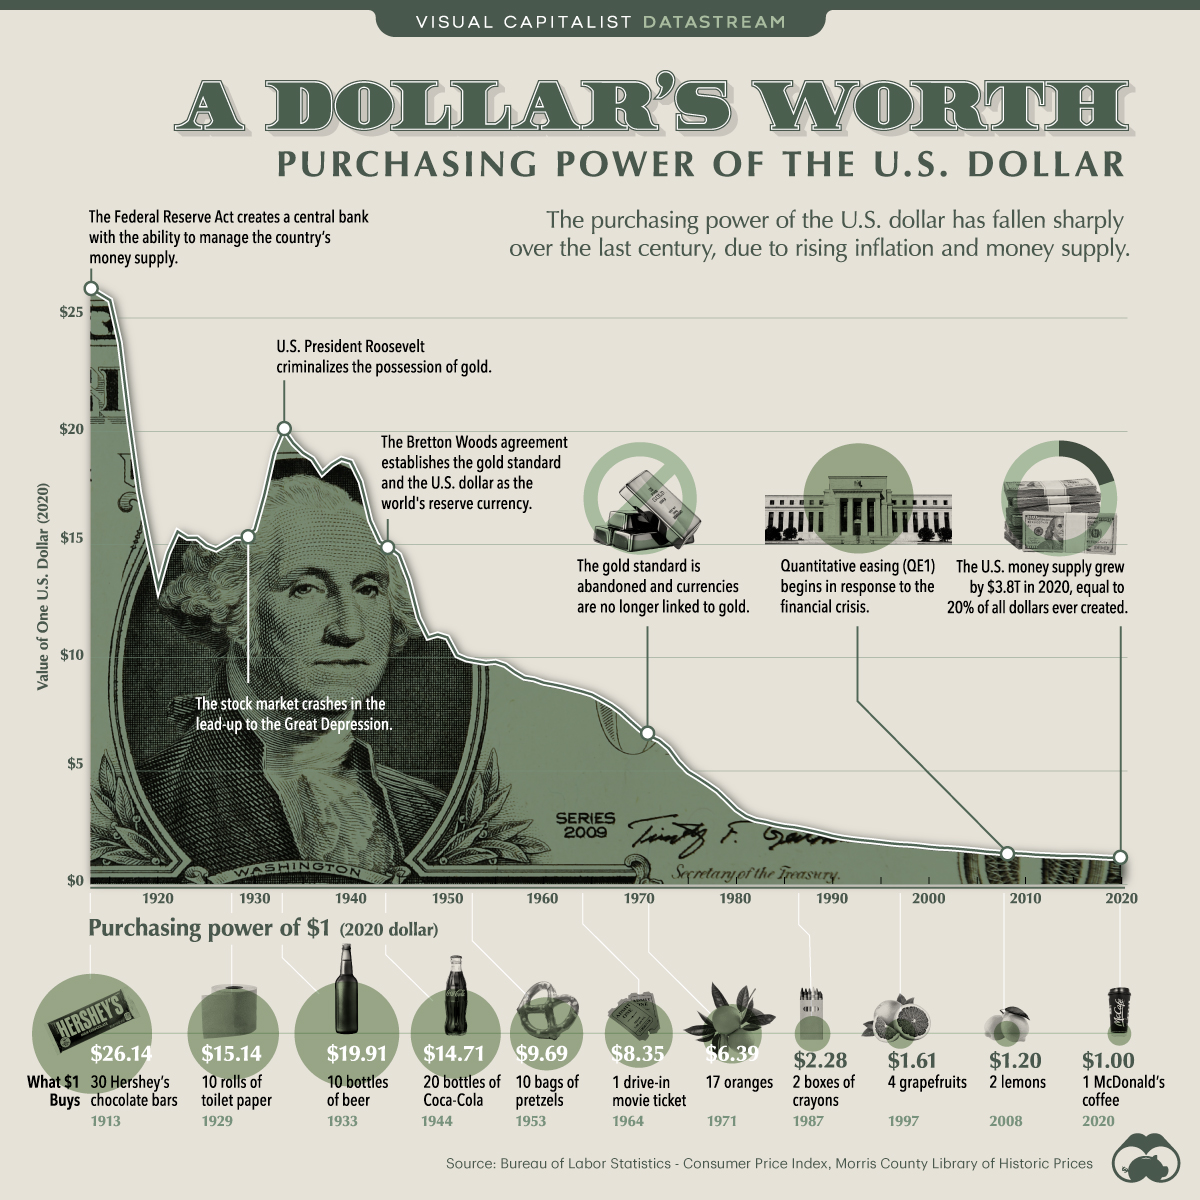
The value of a dollar has been destroyed! End the Fed now!
One could look at a chart like this and conclude hyperinflation or systemwide collapse is imminent.
Or you could look at this chart and conclude you have to invest in productive assets to protect against inflation over the long-run.
Yes, if you buried cash in your backyard, its value would have fallen due to inflation.
But if you instead put that money into short-term T-bills, effectively a cash equivalent in investment terms, you would have grown your money above the inflation rate by around 0.3% per year.
You would have done even better if you invested it in stocks or bonds.
The value of a dollar should go down over the long-term. Why should a piece of paper protect you from the effects of inflation?
I ignore the people who try to scare others with charts that have no context or intellectual honesty.
Further Reading:
The News is Making You Miserable
1I have a theory that The Big Short has likely lost investors — both pros and average Joes — boatloads of money since its publication. I think people read that book and assumed you could just find once-in-a-lifetime trades on a regular basis.
