A reader asks:
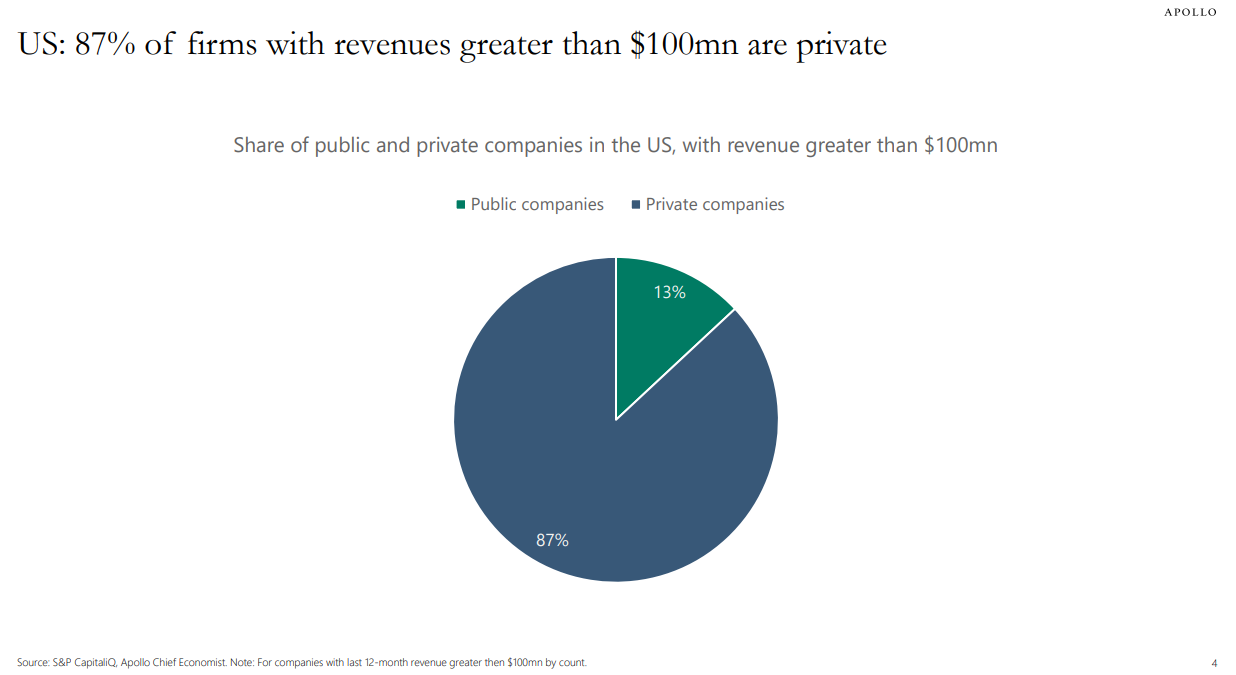
You guys have recently quoted Slock in two podcast episodes that Private Equity Companies, those with over 100 million dollars in revenue make up 87 percent of that category versus only 13 percent of publicly traded company fall into the 100 million in revenue category, and that number is only increasing.
With that said, is this ONE of the reasons stock prices seem to continuously increase. As private equity companies continue to increase in number, there are less publicly traded companies therefore there is more money chasing the ever decreasing number of public companies?
Here’s that stat from Apollo’s Torsten Slok:
The Atlantic shared some data about the dwindling number of publicly traded stocks along with the corresponding growth in private equity investments:
The publicly traded company is disappearing. In 1996, about 8,000 firms were listed in the U.S. stock market. Since then, the national economy has grown by nearly $20 trillion. The population has increased by 70 million people. And yet, today, the number of American public companies stands at fewer than 4,000. How can that be?
One answer is that the private-equity industry is devouring them.
In 2000, private-equity firms managed about 4 percent of total U.S. corporate equity. By 2021, that number was closer to 20 percent. In other words, private equity has been growing nearly five times faster than the U.S. economy as a whole.
Private equity managed less than $1 billion in the mid-1970s. Today it’s more than $4 trillion. There is more than $2.5 trillion in dry powder alone globally:
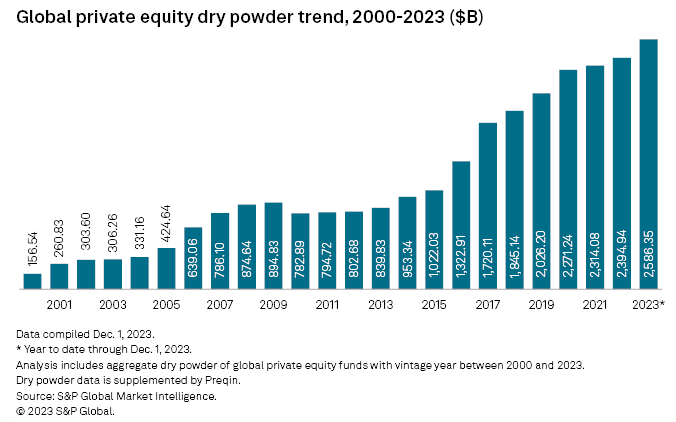
Private equity is a big part of the U.S. and global economy now.
Here’s a look at the shrinking number of public stocks in the U.S. via Barron’s:
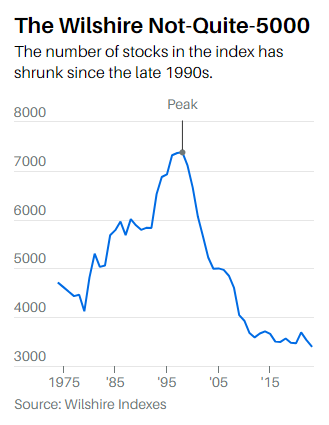
We’ve gone from more than 7,000 stocks in the mid-1990s to more like 3,500 now. The number of public companies has been more than halved.
The Wilshire 5000 is more like the Wilshire 3500. The Russell 3000 currently has only 2,689 stocks.
We’ve reached the point where the indexes feel like false advertising.
From a purely supply and demand perspective, it would make sense that more dollars chasing fewer stocks would drive up prices.
But there’s more going on here. You also have to look at the types of companies that have gone away.
That spike in new corporations during the 1990s was something of an aberration of the dot-com bubble. It was mostly tiny micro-cap companies.
Vanguard shared the data on this with Institutional Investor a few years ago:
Rowley says the proportion of large-cap, mid-cap, and small-cap companies that make up overall market capitalization is very consistent going back to 1979. He says many analysts have made 1996, which had a record number of public companies, a de facto anchor point. However, the late 1990s markets were at a high point, with many companies eager to go public and cash in on rich valuations.
“If you look at the general trend in history, there’s an increase in the number of public companies leading up to 1996, and there’s been a decrease down from that point,” says Rowley. “But again, it’s almost exclusively the domain of micro-cap stocks.”
In 1979, there were 2,044 public micro-cap companies. In 1997, there were 4,193, and in 2014 there were 1,549. But they are a small part of the publicly traded universe. In 1979 and 1997, micro caps represented 3 percent of the market. In 2014, micro-caps represented 2 percent of the market. Micro-caps fell to 1 percent by 2016.
Most of those micro-cap companies from the 1990s ended up going out of business because they had no business model or fundamentals. They were looking to cash in on the euphoria at a time when there wasn’t as much VC or PE money sloshing around.
And micro-cap companies are a sliver of the U.S. stock market from a market cap perspective.
Holding ten one-dollar bills doesn’t put you in a better position than the person holding a single one-hundred-dollar bill.
Sure, there are some smaller companies investors have missed out on because of more venture capital money, M&A and buyout activity. But you could argue the remaining companies are now even higher quality because of this.
Michael Mauboussin wrote a paper about the shrinking number of stocks back in 2017 making this exact argument. This was the main takeaway from that report:
As a result, listed companies today are on average larger, older, and more profitable than they were 20 years ago. Further, they operate in industries that are generally more concentrated. The overall size and maturity of listed companies means they are more likely to pay out cash to shareholders in the form of dividends and share buybacks than companies were in the past.
We speculate that the maturation of listed companies has also contributed to informational efficiency in the stock market. Gaining edge in older and well established businesses is likely more difficult than it is in young businesses with uncertain outlooks. In turn, the greater efficiency may be one of the catalysts for the shift that investors are making from active to indexed or rule-based strategies.
It makes sense this has created an environment where it’s now harder to outperform the market.
There are many reasons the stock market has been going up over time.
The number of stocks listed on the exchange is not one of them.
We discussed this question on the latest edition of Ask the Compound:
Barry Ritholtz joined me on the show this week to answer questions about the actual inflation rate, how fiduciary duty works, worries about U.S. government debt and if we will see a flood of homes hit the market when baby boomers begin dying off.
Further Reading:
The Rebirth of the IPO
