Market cycles operate on numerous time horizons.
Short-term trends which are often impacted by momentum and emotions.
Intermediate-term trends which are more impacted by some combination of flows, themes and fundamentals.
And long-term trends which are impacted mainly by fundamentals.
The hard part about investing is it’s difficult to know in real-time if you’re experiencing secular or cyclical markets. Strategies can remain out of favor for quite some time. Some of them stop working altogether.
One of the hardest questions to answer as a diversified investor is this: Am I being disciplined by sticking to my long-term approach or am I being irrational because the world has changed for good?
Cliff Asness talked about this idea in a recent interview with the Financial Times:
The problem is you have no other choice; no one knows the future. So you allocate what you think is the right amount of risk to things, because the secret is the whole stock market is just as susceptible. Maybe the most interesting example is US versus non-US developed markets. Famously, the US has crushed everyone [in the past 15 years]. During the 15 years prior to that it was: why invest in the US?
It tells you something that the stories can change so much. The US was cheaper than the world in 1990. Now the US is far more expensive than the world. Almost all of the US’s victory was from richening. You can argue if it’s justified, but you tend not to get a repeat — another 30-year relative tripling of the valuation ratio. I tell any US investor with some international diversification: you’re doing the right thing. It’s just the timescales these things work on.
This chart from JP Morgan shows what Asness is talking about with U.S. stocks vs. international stocks:
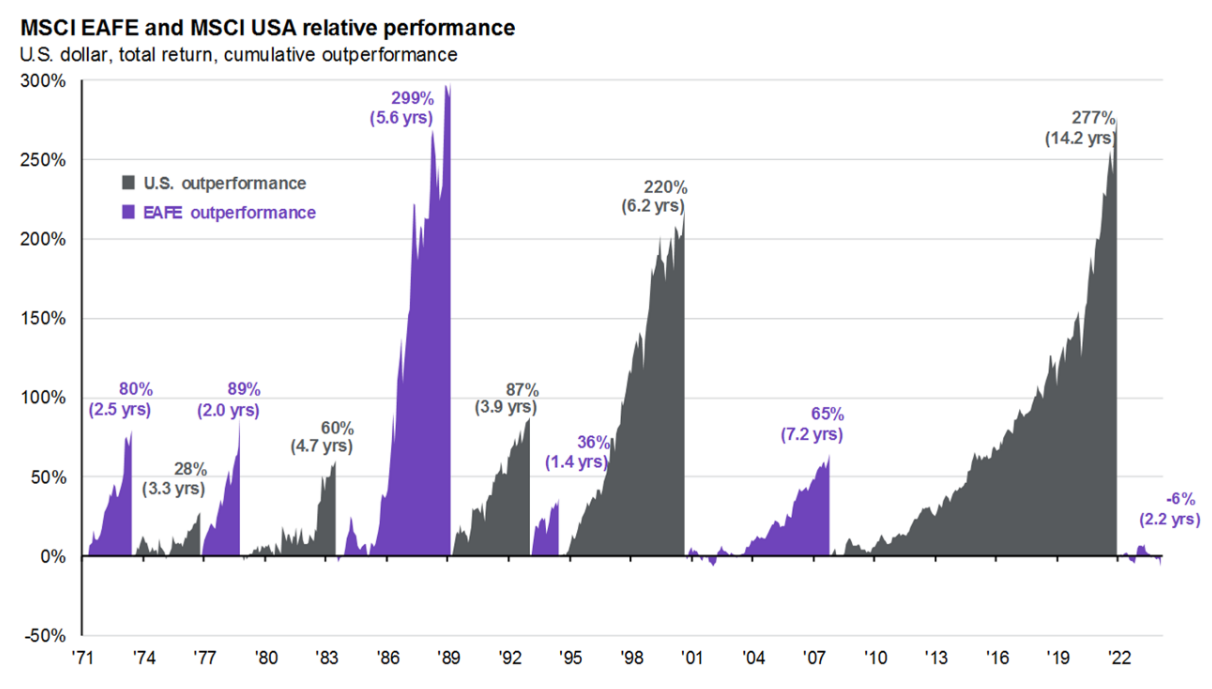
Some of these cycles have been relatively short. The most recent one was very long.
The crazy thing is no one really saw this coming. It seems obvious in hindsight but coming out of the Great Financial Crisis few people were pounding the table on America.
I sat through a lot of pitches on emerging markets, BRICs (China specifically) and commodities in the early 2010s. No one was predicting we would see multiple trillion dollar market cap tech companies emerge as the most dominant stocks we’ve ever seen.
The reason for this is simple — performance.
From 2000-2007, emerging market stocks were up well over 200% in total (15.3% per year). The Chinese stock market was up a similar amount. Commodities went nuts too just before the financial crisis kicked into high gear:
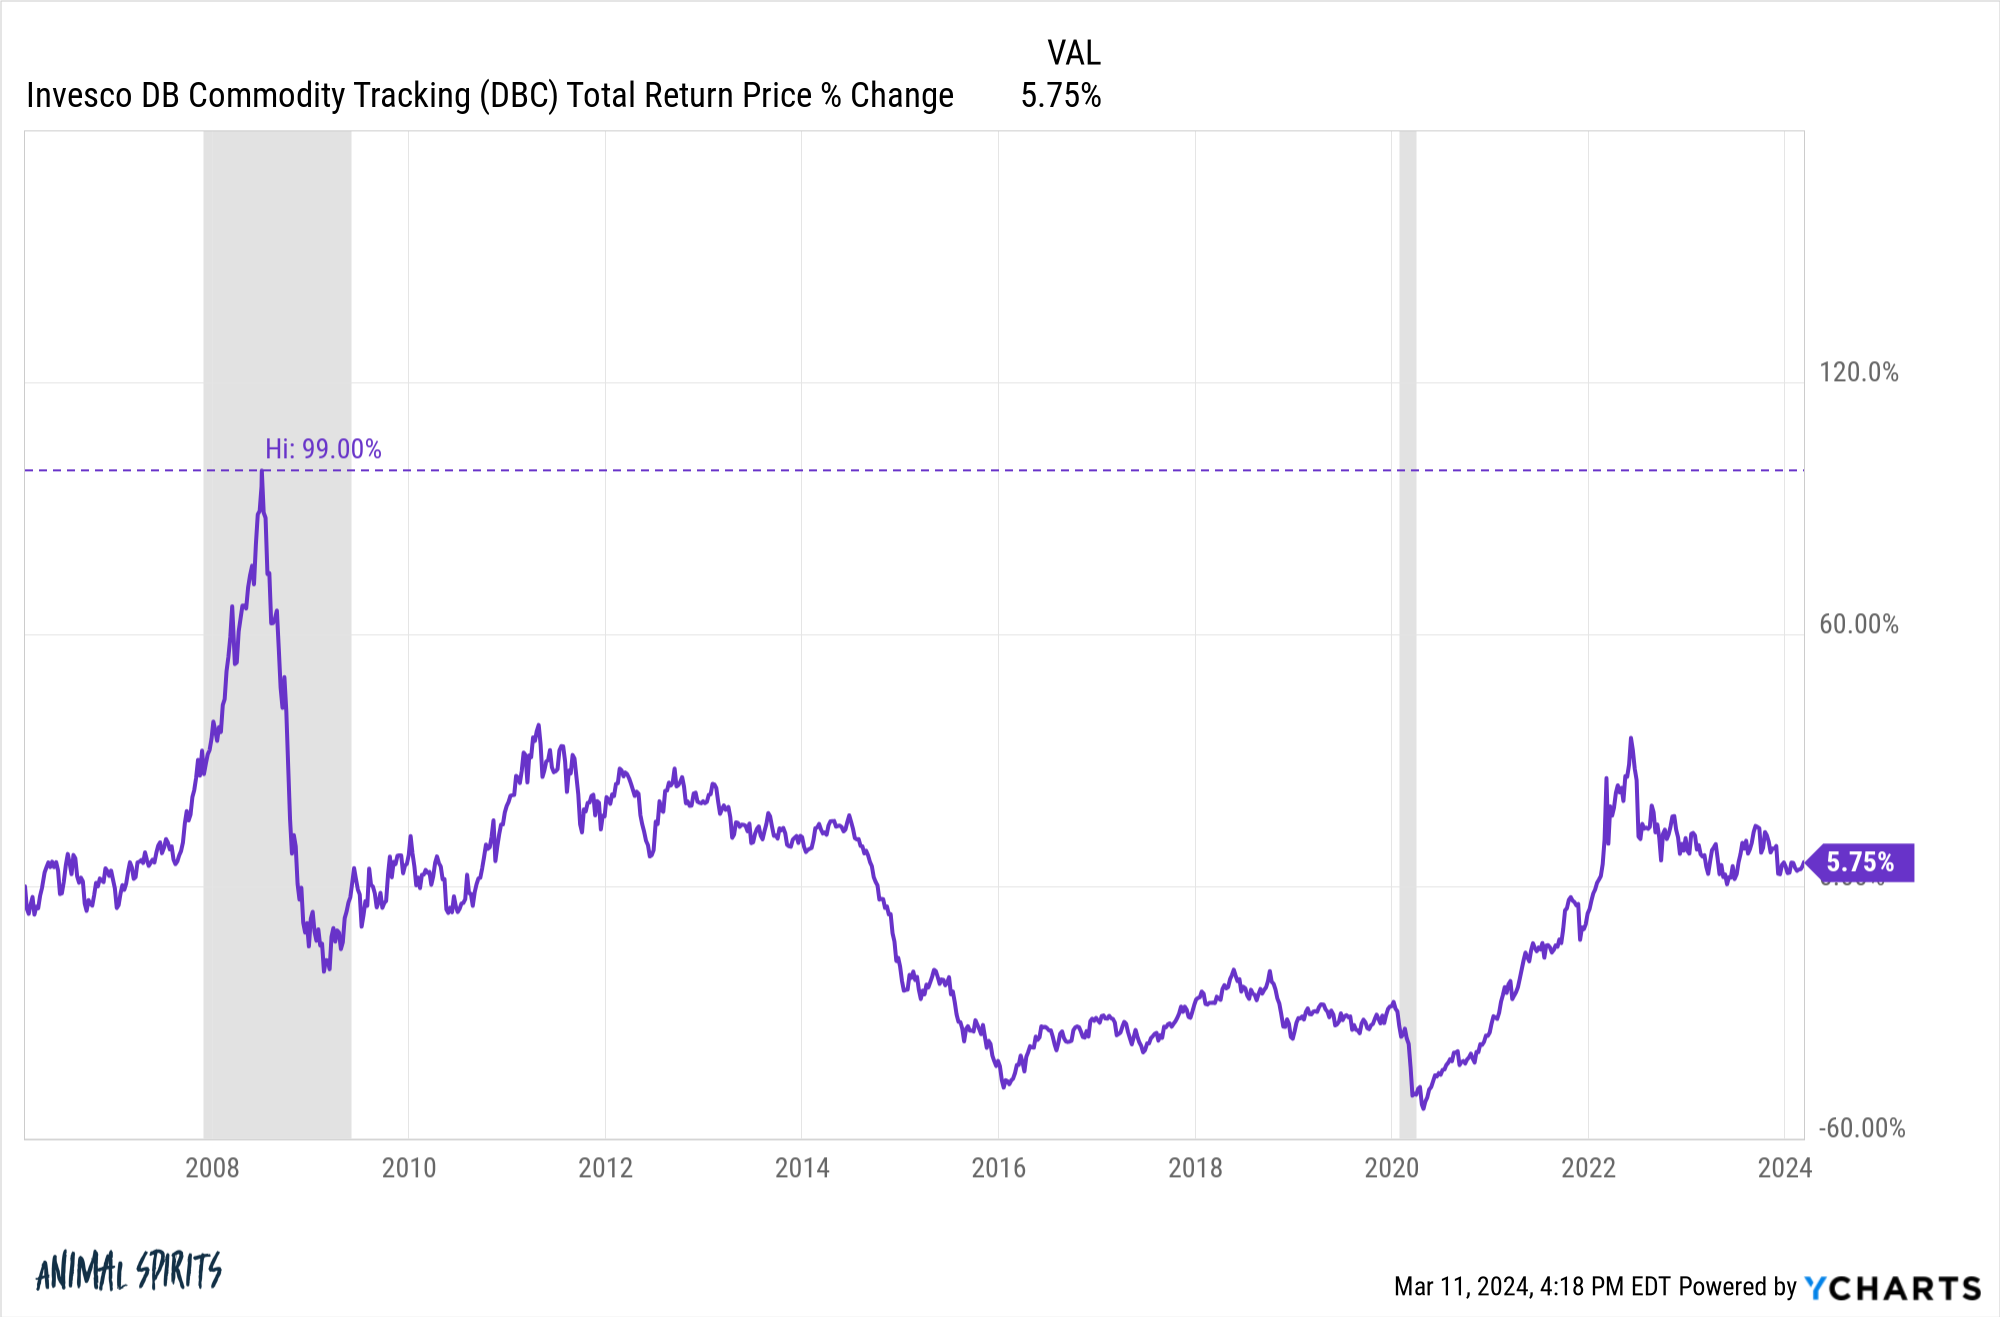
A basket of commodities was up nearly 100% from 2007 through the summer of 2008.
Tech stocks, on the other hand, were in the midst of a mammoth crash.
The Nasdaq 100 fell more than 80% after the dot-com bubble popped:
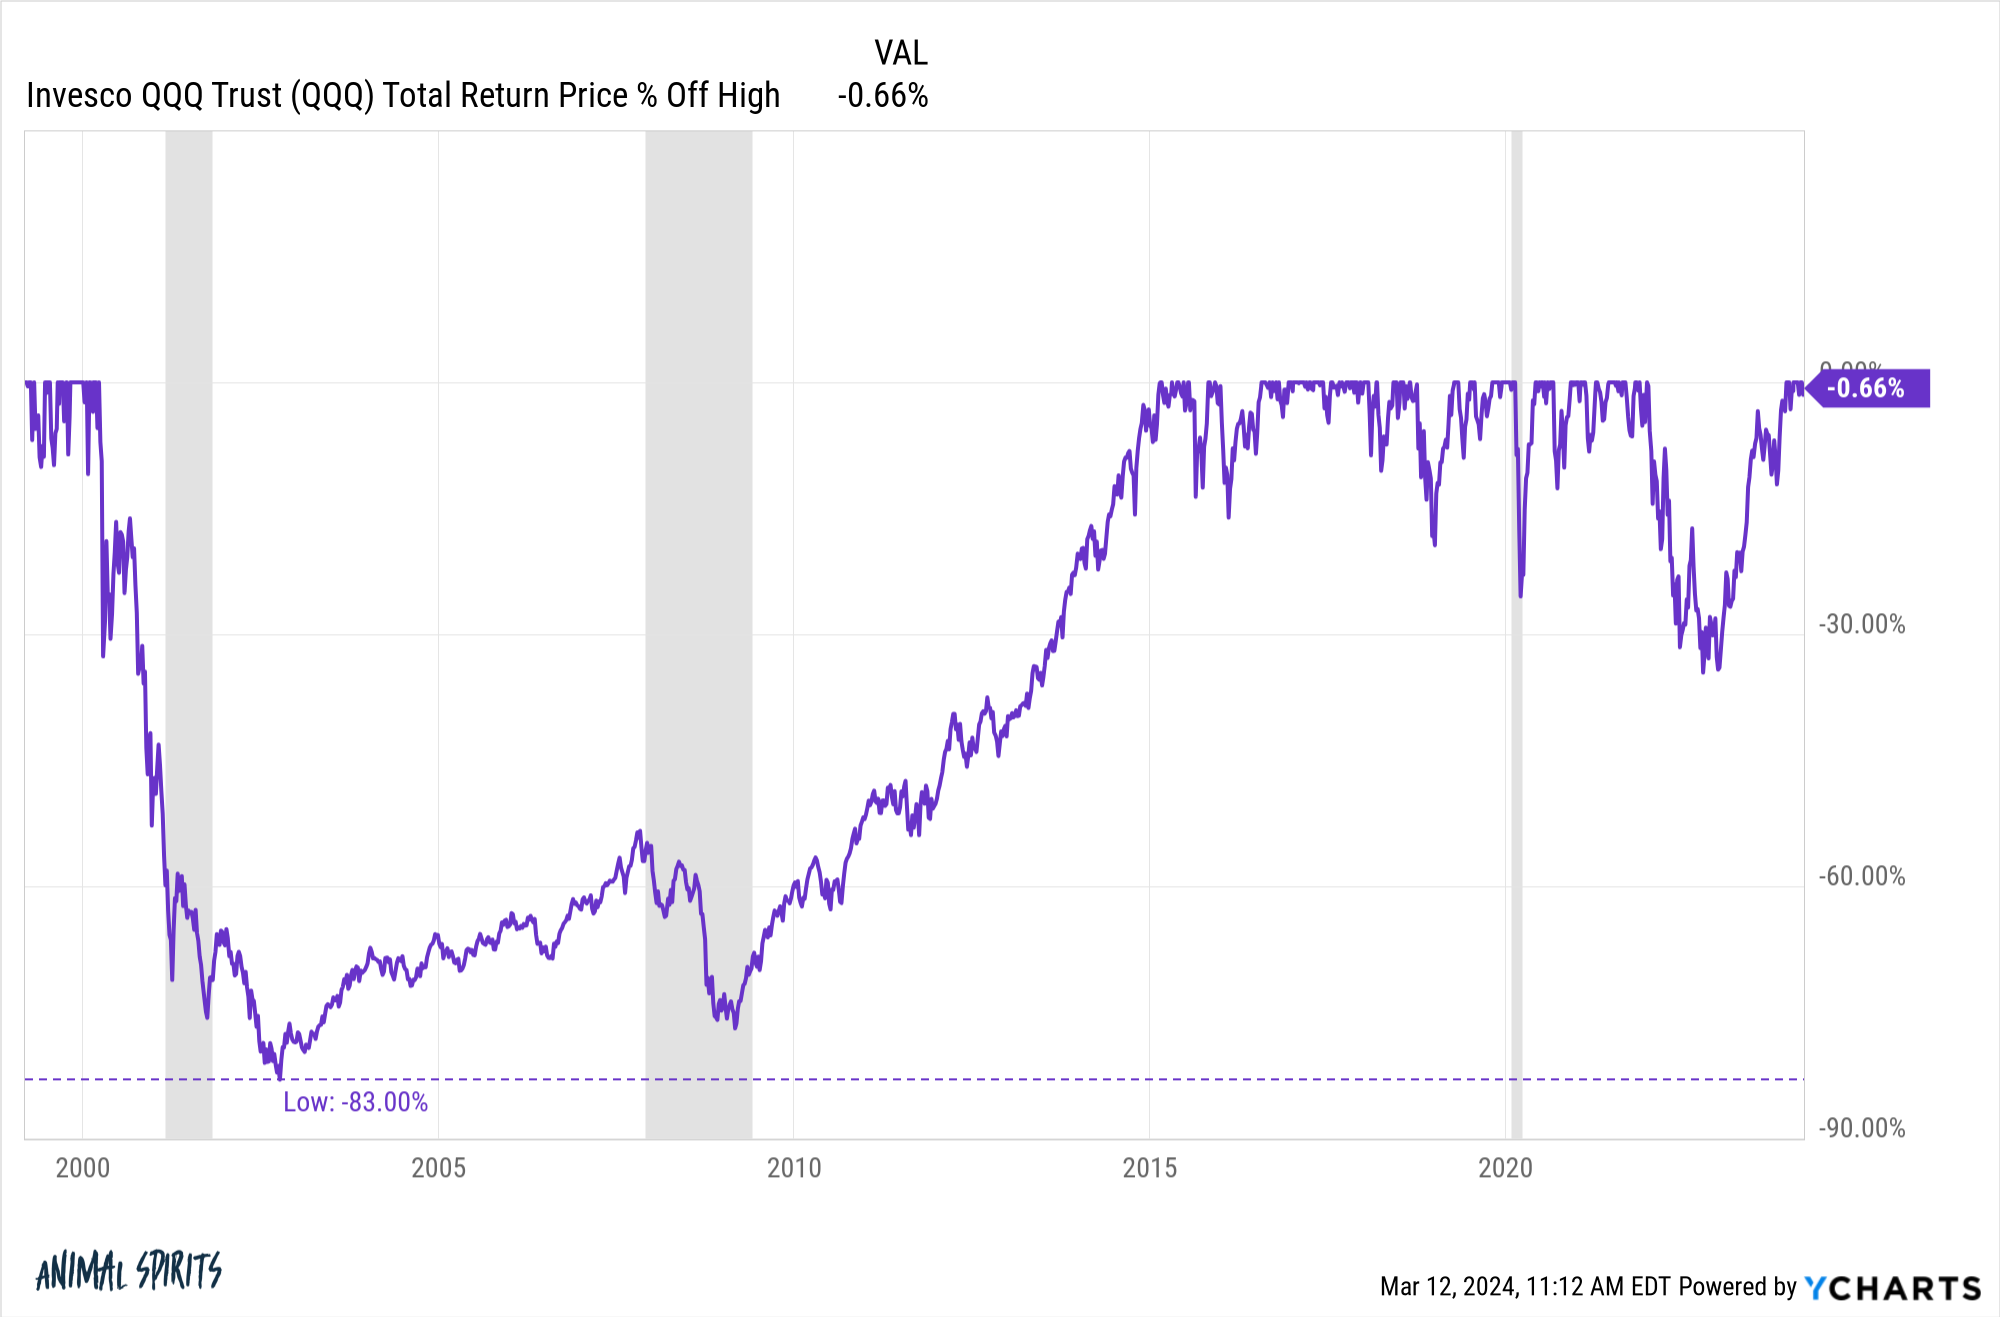
It would remain underwater for 15 years.
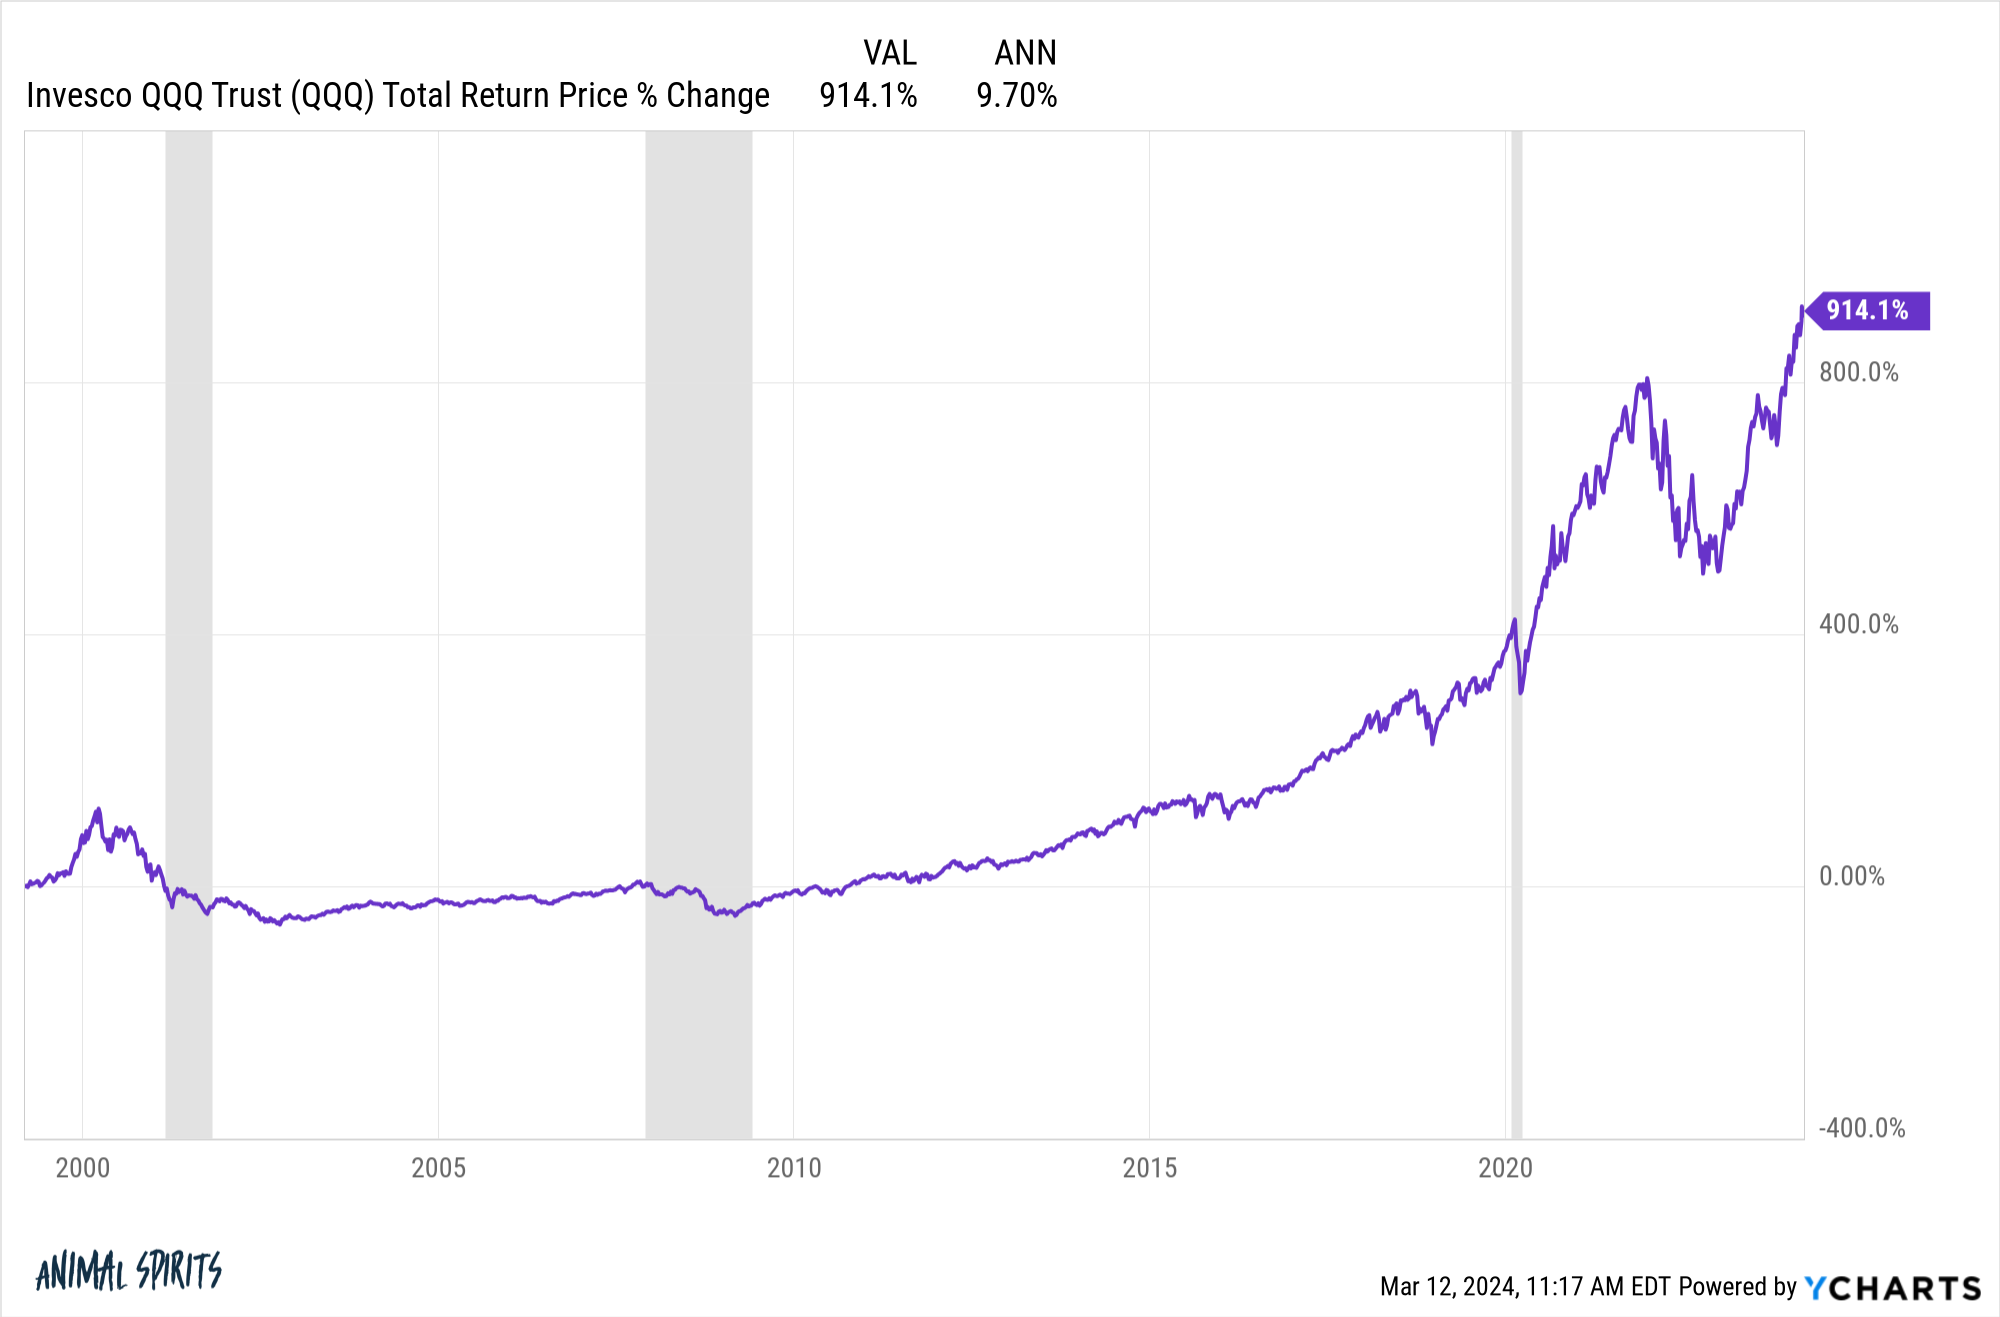
The Nasdaq 100 has been crushing it for well over a decade now. It’s up almost 800% in total since the start of 2012. That’s annual returns of close to 20% per year. If you invested in the Qs you’ve basically been Warren Buffett for more than a decade now.
But the returns before this cycle were dreadful. From the inception of the Nasdaq 100 ETF (QQQ) in early-1999 through the end of 2011, the fund was up a total of 14.3%. That’s 1% per year for 13 years.
Interestingly enough, if we mash these two diametrically opposed cycles together you basically get the long-term average return of the stock market since the inception of this ETF:
The current cycle has lasted for more than 10 years. The previous cycle also lasted for 10+ years. One was incredible for investors. The other was a swift kick to the private parts.
Both cycles have been extreme but sometimes that just happens in the markets.
You don’t get the good without the bad.
Asness is right that U.S. stocks haven’t always been the darlings they are today. The Credit Suisse Global Investment Yearbook has a great chart that shows the evolution of global equity markets since the turn of the 20th century by country weights:
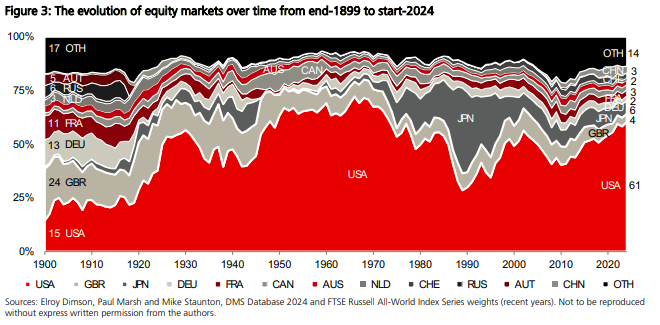
The U.S. stock market was relatively small in 1900. By the 1950s, 1960s and 1970s we had the dominant position globally. But Japan gave us a run for our money in the 1980s. By 1990, Japan made up nearly 50% of global equity markets, while U.S. stocks were down to roughly one-third of the total.
Despite the healthy bull market in the 1980s, U.S. stocks badly lagged the rest of the world for two decades. These were the total (and annual) returns from 1970-1989 for foreign developed (MSCI EAFE) and U.S. stocks (S&P 500):
- Foreign stocks: +1,934% (+16.3%)
- U.S. stocks: +790% (11.6%)
In the 1990s, U.S. stocks played catch-up in a big way. In the 2000s, international stocks regained the lead. Since the start of the 2010s, U.S. stocks have sprinted ahead yet again.
My point here is these cycles are normal.
You can go through periods of underperformance for 10+ years and have no idea if or when your strategy will come back into favor.
You can go through periods of outperformance for 10+ years and have no idea if or when your strategy will go out of favor.
The problem with these types of cycles is it’s impossible to avoid recency bias because it feels as though these trends will persist indefinitely into the future.
America is dominating the rest of the world right now in terms of economic and financial market performance. I’m not willing to bet against America in the long run.
But Japan was dominating the rest of the world in the 1980s.
China was dominating the rest of the world in the 2000s
The UK was dominating the rest of the world coming into the 1900s.
Maybe the U.S. stock market is just plain better. Maybe tech stocks will outperform forever. Sometimes it’s different.
But I’m not willing to go all-in on that bet.
I still think international diversification is a prudent form of risk management.
Today’s winners will become tomorrow’s laggards at some point. I just don’t know when and I don’t know why.
Further Reading:
Can Anyone Challenge the Economic Dominance of the United States

