One of the reasons the current housing market is so frustrating for homebuyers is how quickly things have changed.
For years, housing prices were reasonable (in most places) while mortgage rates were low. Housing was affordable for most buyers.
It’s not anymore.
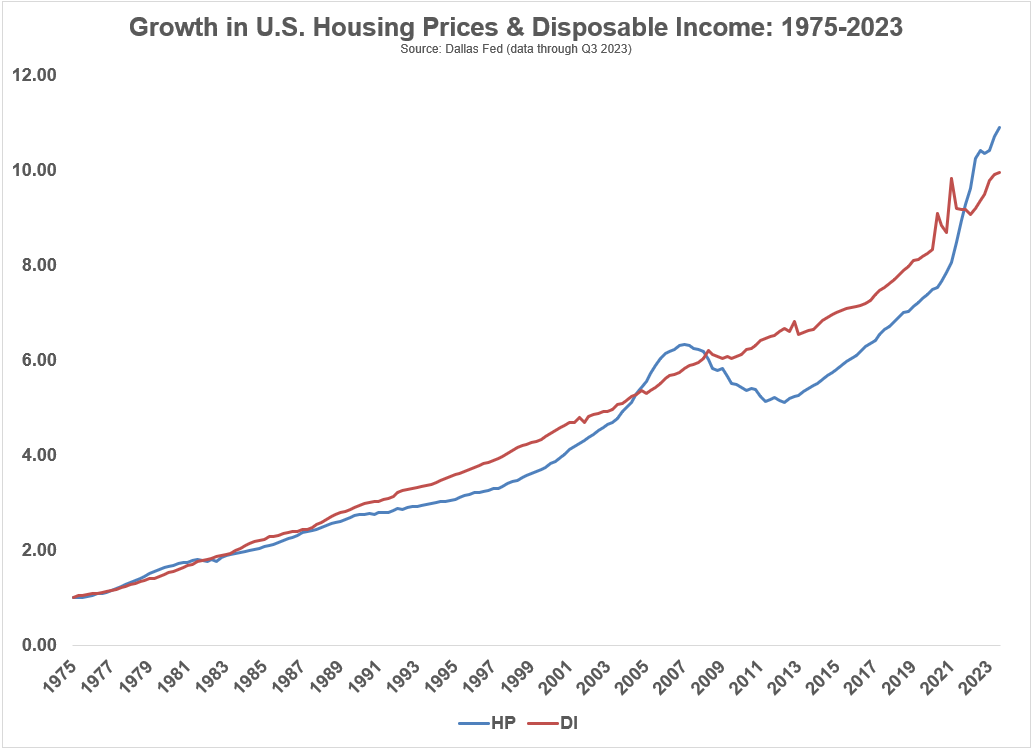
I updated the growth of housing prices and disposable income going back to 1975:

The growth in prices was far below the growth in disposable income for much of the 2010s. That relationship was turned on its head during the pandemic.1
We’re now at the widest spread between prices and incomes since the inception of this data in 1975.
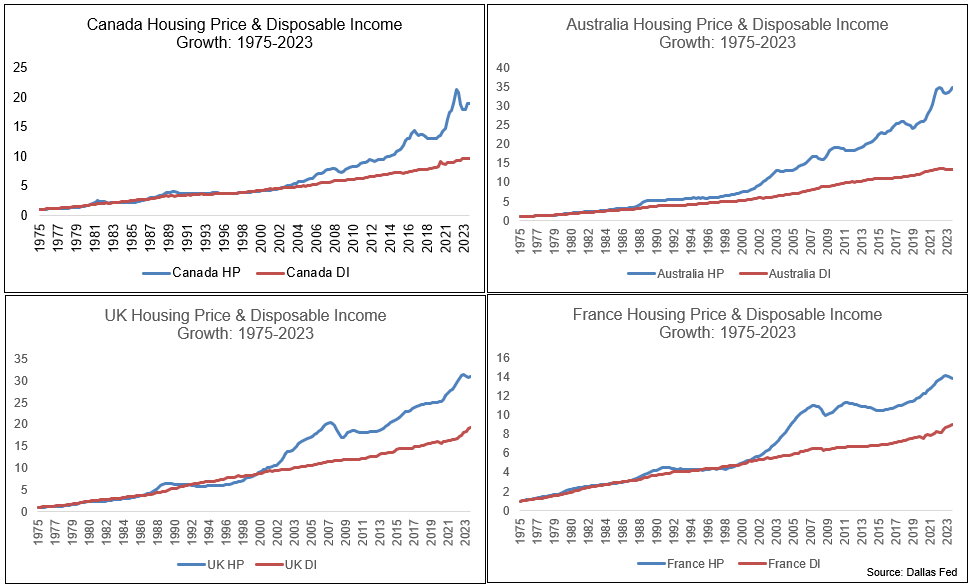
But it’s not that bad on a relative basis. These numbers are far worse in places like Canada, Australia, the UK and France:

Obviously, these numbers don’t help U.S. homebuyers feel any better but it could always get worse.
However, it’s important to recognize that while national housing data makes for good charts, local housing data is the only thing that matters to individual homeowners and buyers.
National home prices aren’t completely out of whack with disposable incomes like they are in Canada or Australia, but they are in many areas of the country.
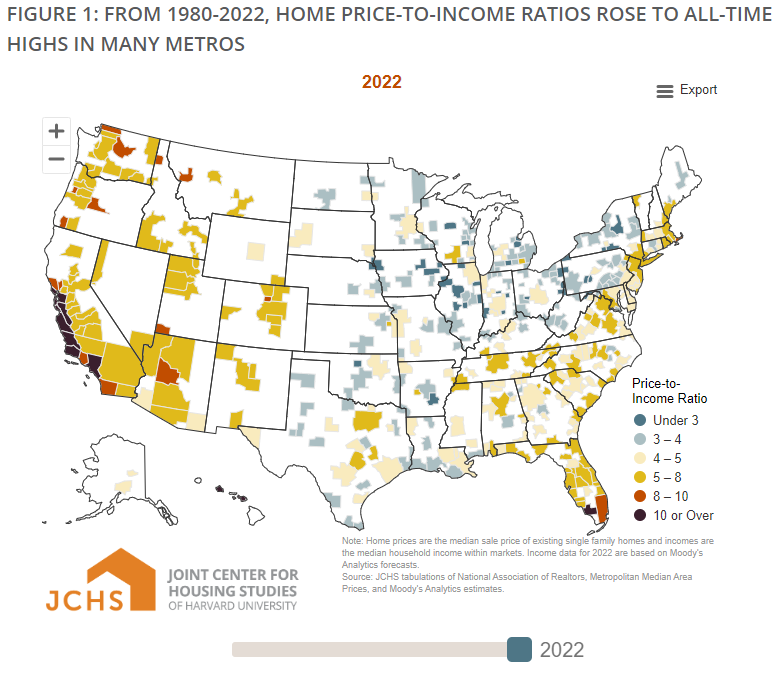
Researchers at Harvard broke down the home price-to-income ratios in metro areas all across the country from 1980 to 2022. Here’s the latest data:

The country as a whole is now at all-time highs going back to 1980 but there are certain parts of the country where things are starting to get out of hand. We have pockets of Canada and Australia here in the U.S. in places like California, the northeast, northwest and Florida.
Our media team created a graphic that shows how these numbers have changed over the years as well:
Southern California is basically the only area of the country that has more or less always been expensive relative to income.
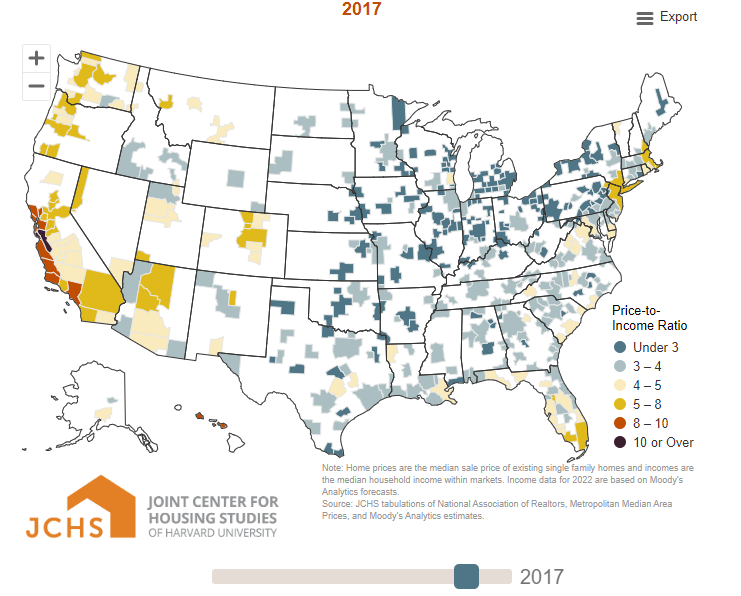
But the majority of the country was relatively affordable for much of the past 40 years or so right through the 2010s. Even as recently as 2017 the country was still mostly covered in blue:

Now the only part of the country that looks relatively affordable is the Midwest. I’m from the Midwest and it’s a wonderful place to live but it’s not so easy for people to uproot their lives to move to a more affordable housing market.
Remote work opportunities help in this regard but it’s tough to move away from friends and family simply because it costs so much to buy a house.
I don’t really have an answer here beyond the fact that we need to build more homes.
Hopefully mortgage rates will fall this year when the Fed cuts rates. That should help, assuming it doesn’t cause a flood of demand from buyers who have been sidelined.
We could see some opportunities in the housing market in the 2030s as the baby boomer generation sunsets their houses but that’s not a foregone conclusion.
In the meantime, the affordability situation is likely to get worse before it gets better with the millions of young people looking to buy.
Michael and I talked about housing affordability and more on this week’s Animal Spirits video:
Subscribe to The Compound so you never miss an episode.
Further Reading:
How to Buy a House in Today’s Market
Now here’s what I’ve been reading lately:
- The great non-recession (Cubic Analytics)
- Madoff outperformed the permabears (The Better Letter)
- Quality growth (Irrelevant Investor)
- When does it make sense to self-insure your home? (Belle Curve)
- Investing in stocks at all-time highs (Of Dollars and Data)
Books:
1Quick reminder: These charts are comparing the growth in disposable income to the growth in housing prices since 1975. All figures are nominal.
