I saw a chart this week from Bank of America that more or less sums up my entire investment philosophy:
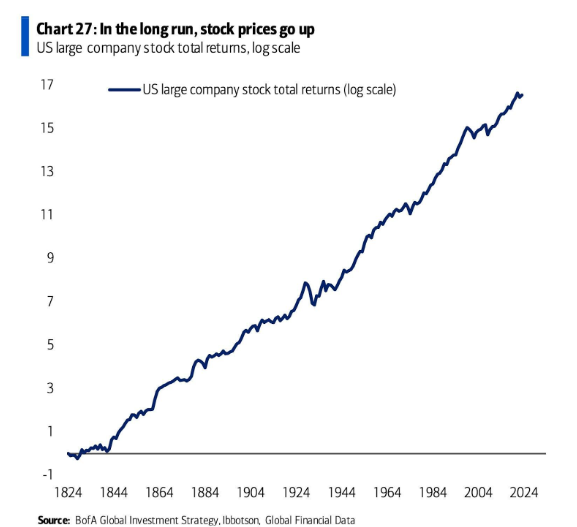
In the long run, stock prices go up.
I view the stock market as a way to invest in innovation, profits, progress and people waking up in the morning looking to better their current situation.
While I love the fact that this chart illustrates my long-term philosophy it’s a bit misleading. Yes, the stock market goes up over the long run but it can also get crushed in the short run. That can be difficult to see on a log chart with 200 years of data.
The Great Depression, 1987 crash and Great Financial Crisis look like minor blips on this chart. And while every crash eventually turns into a blip on a long-term chart, they don’t feel like it in the moment.
Looking at this chart got me thinking about what other visuals I would use to help explain the stock market in greater detail. Here are a few more:
You can’t look at an up-and-to-the-right chart of the stock market without taking into account the drawdowns along the way:
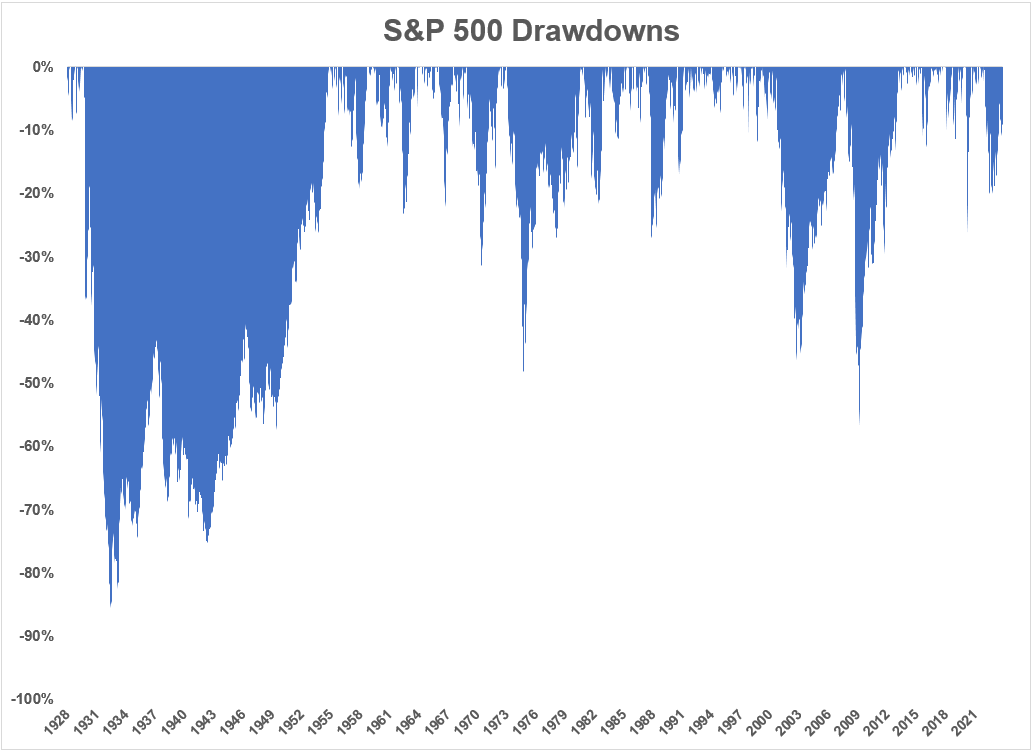
The Great Depression was not a blip. It was a tsunami. People thought the 1987 crash was going to lead to a depression. The financial system was teetering on the brink of extinction in 2008.
Sometimes the stock market crashes. Sometimes it takes years to make your money back.
You don’t get a long-term chart of stocks that moves up over time without getting your face ripped off on occasion. If you can’t survive the short-term drawdowns, you don’t get to participate in the long-term gains.
This is true for market crashes, run-of-the-mill bear markets, terrible years and even good years in the stock market.
Another favorite chart of mine that helps explain the stock market is by looking at the annual returns matched up with intra-year drawdowns:
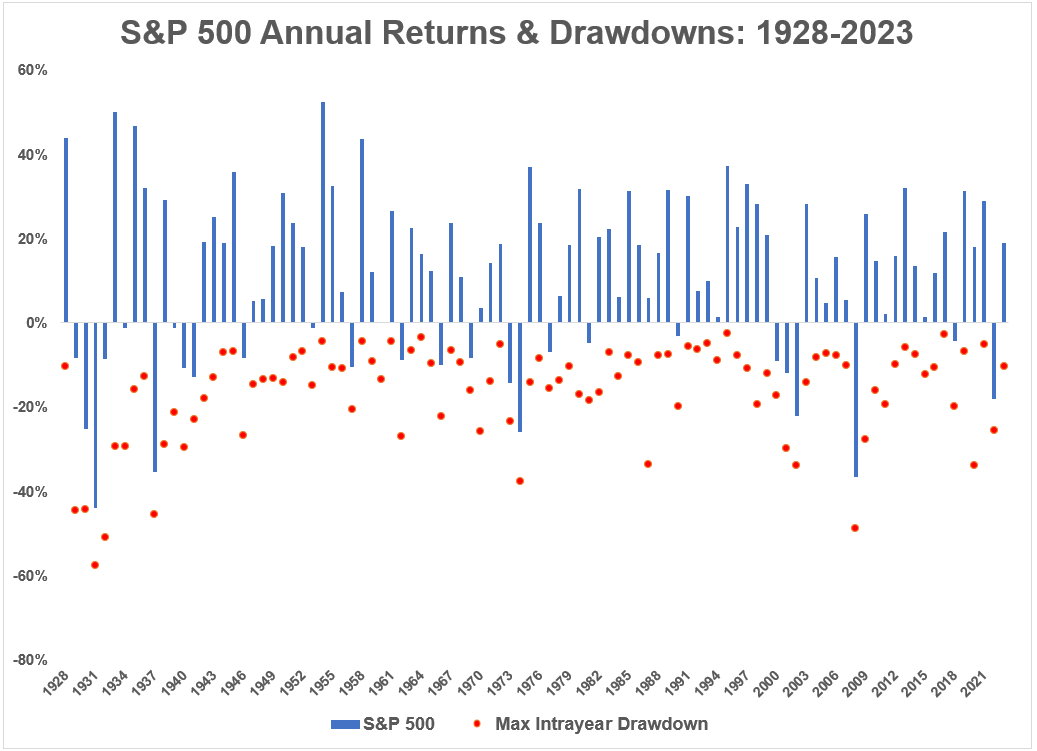
The average intrayear peak-to-trough drawdown since 1928 was -16.4%. Losses in the stock market should be expected.
The other takeaway from this chart is that drawdowns happen even when the stock market finishes the year in positive territory.
The average intrayear drawdown in years that have finished with a positive return for the S&P 500 going back to 1928 is -11.6%.
So you should expect to experience downside volatility even when stocks are in an uptrend.
In fact, the average drawdown when the S&P 500 has been up by 20% or more during a given year is -11%. You’ve had to live through a double-digit drawdown in roughly half of all 20%+ up years in the stock market over the past 95 years of returns.
Think about that — to get to 20% or more you have to live through a correction in half of all years.
The other surprising stat here is the sheer amount of 20%+ returns you see in the stock market in a given year.
In 34 of the past 95 years, the U.S. stock market has finished the year with gains of 20% or more. That’s a greater percentage of years (36%) than the number of years that finish with a loss (27%).
Of course, gains or losses in any one year are meaningless. All wise investors know the only time horizon that truly matters is the long-term.
Historical numbers have shown the longer your time horizon, the better your odds for success and the less variable your range of returns are:
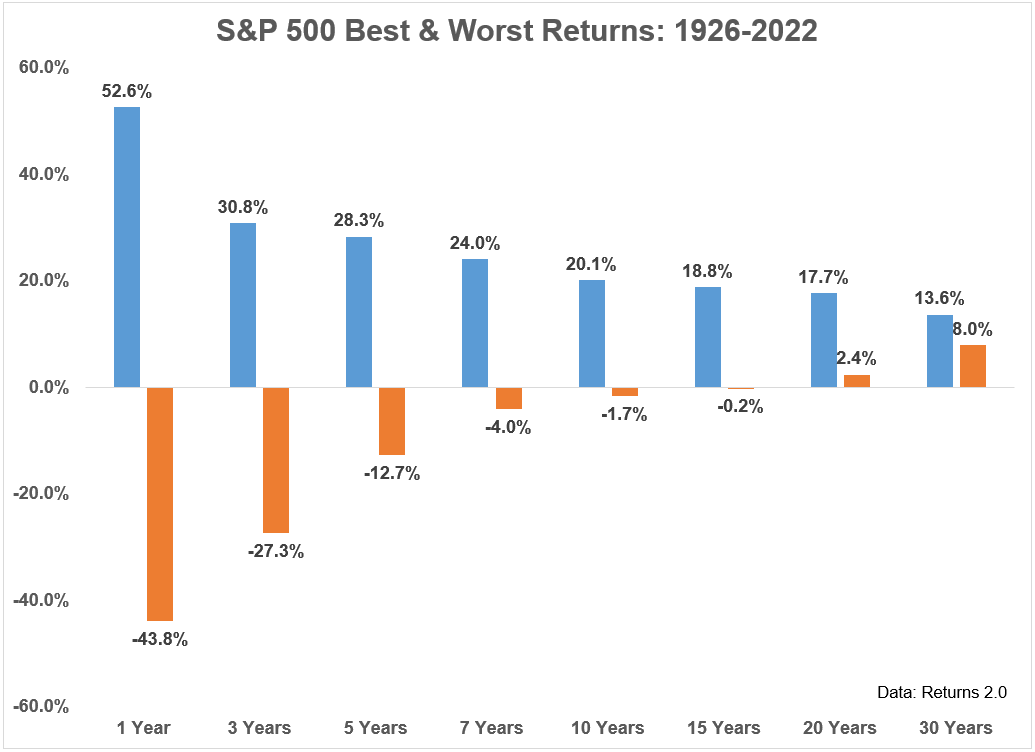
There are no guarantees when investing in the stock market.
Bad things can and will happen.
But if you have a time horizon that is measured in decades as opposed to days, months or years, you’re going to be better off than most investors.
I can’t promise these relationships will continue in the future.
But I have a hard time believing we’re going to have a future where people aren’t innovating, making progress and waking up trying to better their station in life.
That’s the lifeblood of corporate profits and that’s why I’m a believer in the stocks for the long run.
Michael and I talked about long-term stock market charts and much more on this week’s Animal Spirits video:
Subscribe to The Compound so you never miss an episode.
Further Reading:
The Stock Market is Not a Casino
Now here’s what I’ve been reading lately:
- How safe is an 8% withdrawal rate? (Dollars and Data)
- Can the Fed finally declare victory? (Disciplined Funds)
- How to talk to your kids about money (Contessa Capital Advisors)
- How to stop the retail therapy (Vox)
- The invisible barrel of reality (Safal Niveshak)
Books:

