Here’s something Henry Blodget wrote about notorious stock market bear John Hussman:
Every historical indicator Hussman is looking at is suggesting that the stock market is wildly overvalued and headed for a period of lousy returns. How lousy? John Hussman thinks there’s a good chance the stock market will soon crash 40-50 percent.
And even if the market doesn’t crash, Hussman thinks stocks are priced to produce returns of only a couple of percentage points per year over the next decade–far below the 7 percent inflation-adjusted long-term return that everyone is used to and the double-digit returns of the last few years. If you want to feel comfortable and happy, go ahead and ridicule John Hussman with everyone else. If you want to prepare yourself for what seems like a likely possible stock-market future, however, read on.
Sounds scary, right?
The prospects of a 40-50% crash or minuscule returns going forward wouldn’t be much fun for stock market investors.
Here’s the problem with Blodget and Hussman’s predictions — this piece was written in the summer of 2013!
We can actually look at the past decade of returns for the U.S. stock market to see how reality lined up with this dire forecast.
In the 10 years following Hussman’s prediction of a 40-50% crash or lousy returns for a decade, the S&P 500 was up more than 230% in total or 12.8% on an annual basis:
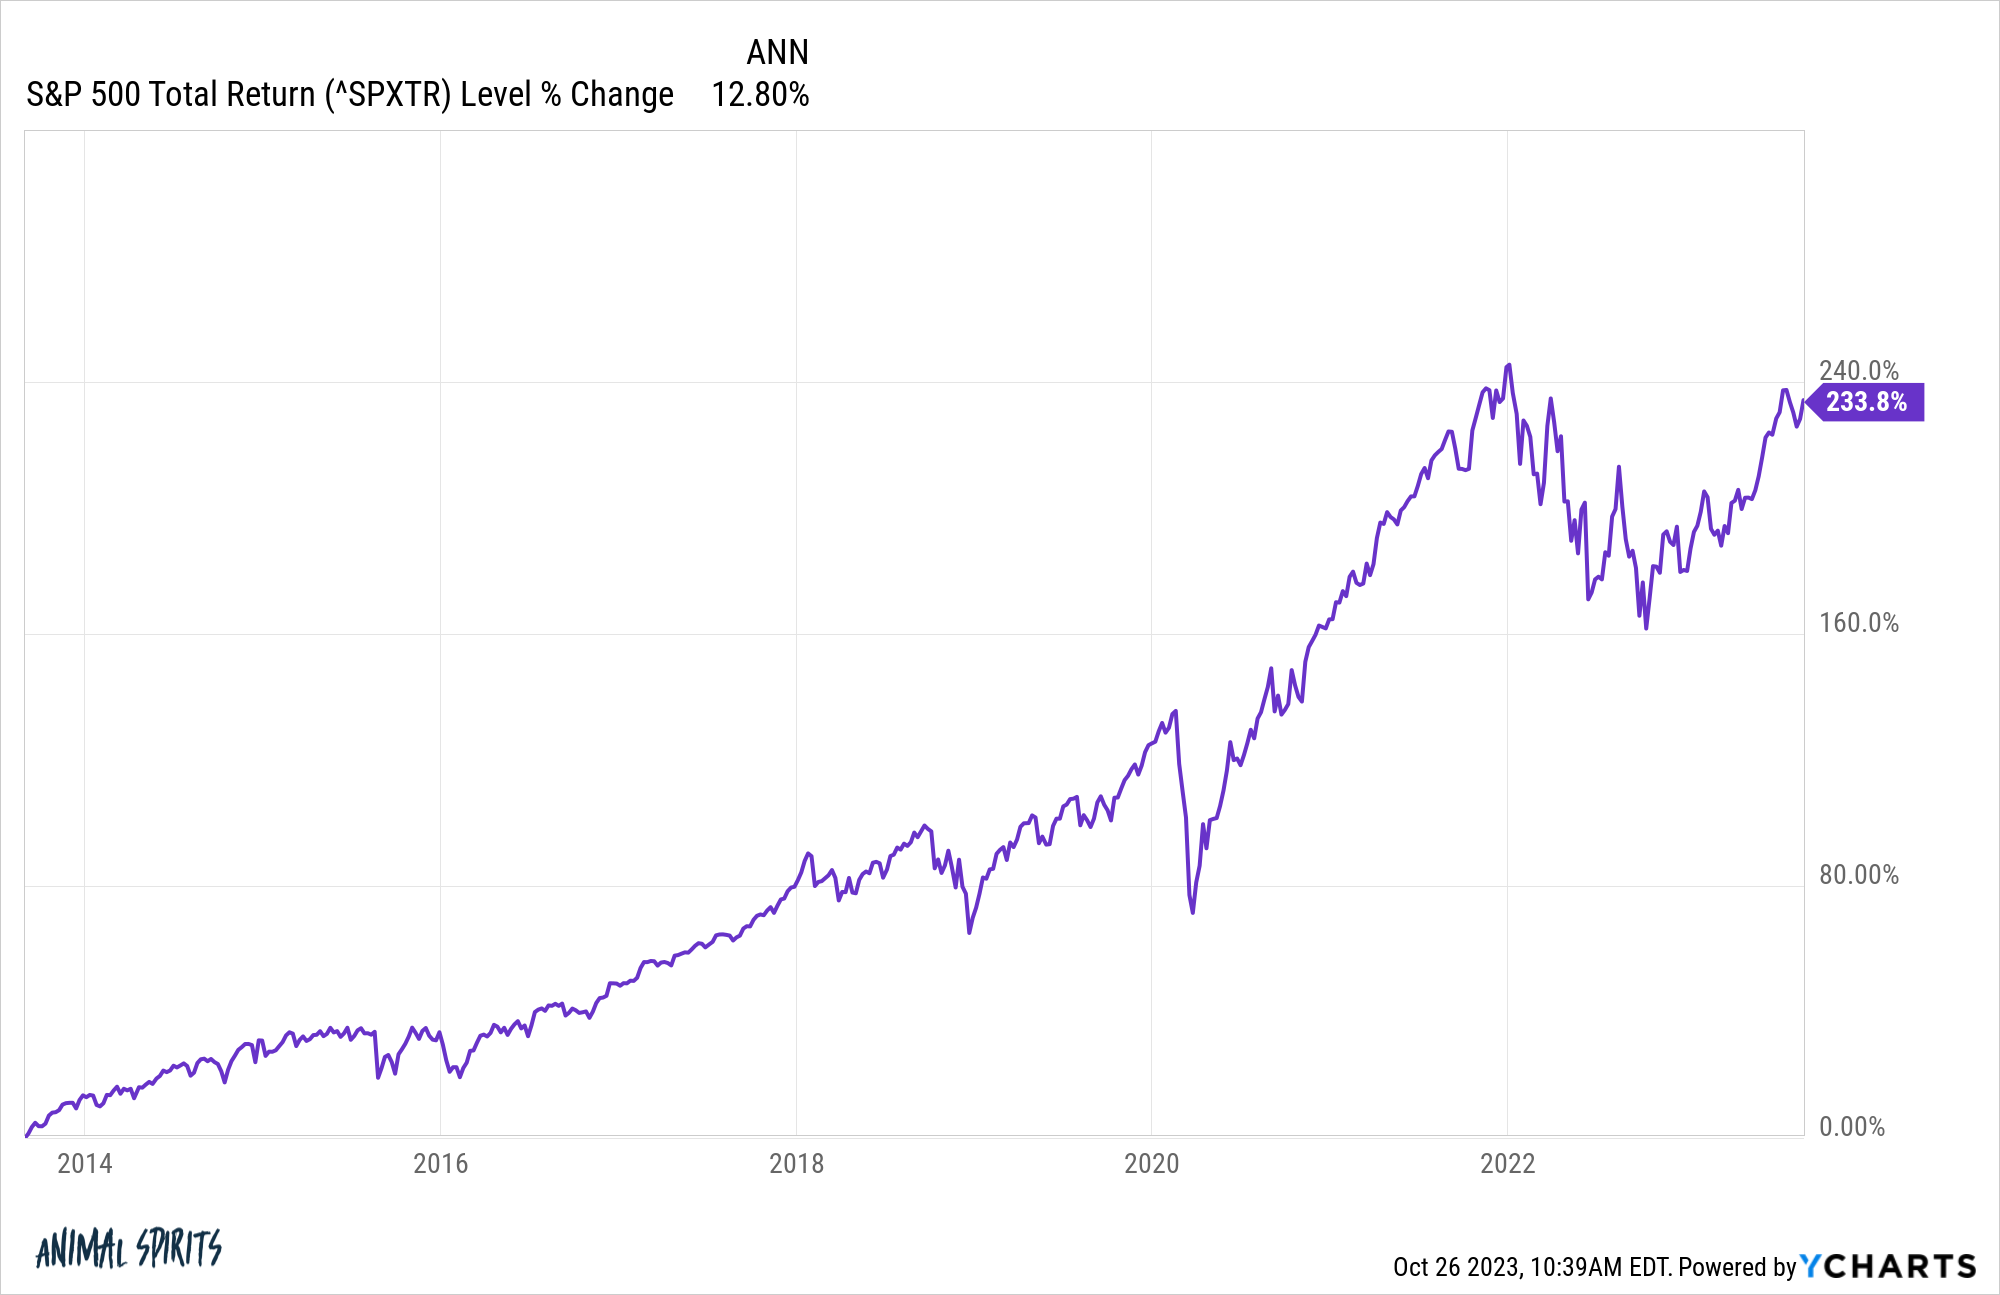
Sounds pretty good to me. If you’ve been sitting in cash this entire time you’ve missed out on a glorious bull market.
The stock market did fall in those ensuing 10 years, of course.
During the pandemic, the stock market crashed 34% in a little over a month. Last year the S&P 500 was down more than 25% from the highs at the depth of the inflationary bear market. But stocks are still sitting on extraordinary gains over the past 10 years.
Did Hussman relent from his crash-calling ways? No. He’s still out there calling for a crash, only this time it’s going to be even bigger!
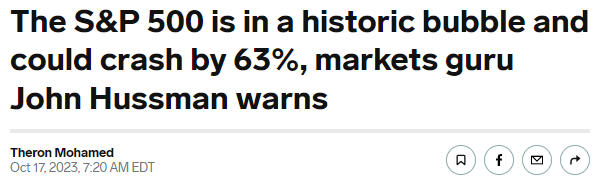
If at first you don’t succeed…
When Hussman called for a 40-50% crash in August 2013, he said the Dow could fall somewhere in the 7,500-8,500 range. From current levels at around 32,800 the Dow would need to fall 55% just to get back to the point where Hussman made his initial prediction in 2013 and then another 50% from there to hit that target range.
As always, predictions are hard, especially about the future.
Anything is possible in the markets but this is the problem with listening to people who predict crashes for a living. They only need to be right once in a row to get attention from the media. If you follow their predictions the vast majority of the time you’re going to be on the wrong end of history.
To be clear, I’m not saying the market won’t crash at some point. It can and will happen eventually. Crashes are not highly probable, but you will experience a handful of these cataclysmic events throughout your investing lifecycle.
It comes with the territory.
I looked at the daily returns on the S&P 500 going back to 1950 to see how often the market was in a state of drawdown at different levels of losses:
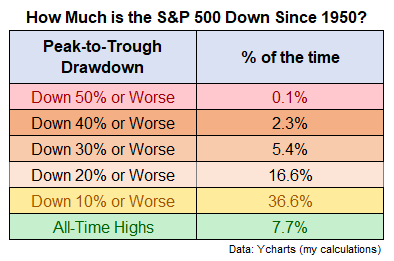
We’ve had 40% and 50% crashes but it’s pretty rare. You don’t spend all that much time there as an investor. Sometimes you’re going to get your face ripped off in the markets and learn to live with it but you can’t shouldn’t expect it to happen all the time.
The market has been in a bear market (down 20% or worse) nearly 17% of the time. That’s more than double the amount of time we’ve spent at new all-time highs over the past 75 years or so.
In fact, the average drawdown from all-time highs for the S&P since 1950 is close to 10%.1
Investing in the stock market means becoming comfortable living in a state of drawdown most of the time, but that doesn’t mean you should always remain in the fetal position.
There are also going to be times when returns will be low for an extended period of time.
I looked at the rolling 10 year returns for the S&P 500 going back to 1950 to find the distribution of annual returns at various levels:
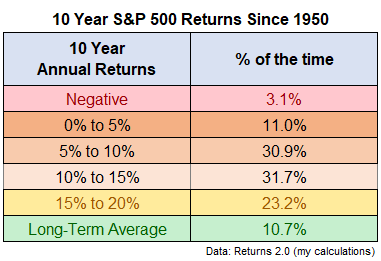
More than 3% of the time returns have been negative over 10 year time frames. Annual returns have been 5% or worse 14.1% of the time. That’s not great.
However, annual returns have been 10% or higher 55% of the time. Annual returns of 8% or more have occurred in nearly 70% of all rolling 10 year windows since 1950.
Most of the time good things happen in the markets but sometimes bad things happen.
The people who predict a crash every single year will be “right” eventually. The same is true for those who are constantly forecasting a recession.
But they will be wrong the majority of the time.
The stock market has been up roughly 75% of the time over one year periods and nearly 97% of the time over 10 year time frames over the past 70+ years.
The U.S. economy has been in a recession 16% of the time since The Great Depression. That means 84% of the time the economy has been expanding.
Most of the time things are going up but sometimes they go down isn’t nearly as sexy as predicting a historic stock market crash or the recession to end all recessions all the time.
But it’s far more helpful for people who actually want to make money on their investments.
Michael and I talked about crash callers and much more on this week’s Animal Spirits video:
Subscribe to The Compound so you never miss an episode.
Further Reading:
Even When the Stock Market Goes Up It Still Goes Down
Now here’s what I’ve been reading lately:
- Sailing away off into the sunset (Contessa Capital)
- Dollars are for spending & investing, not saving (Big Picture)
- What is the average net worth of Americans by age bracket? (Dollars & Data)
- Why aren’t stocks down more? (Irrelevant Investor)
- Why are young people rich and miserable? (Young Money)
Books:
- Judgment Prey by John Sandford
- Since Yesterday: The 1930s in America by Frederick Lewis Allen
- Same as Ever by Morgan Housel
1The median drawdown is more like 6% from the highs at any given point.

