The housing market is broken. Affordability is as bad as it’s ever been. Mortgage rates are high. Prices are high. There is no supply on the market. It’s a mess. So who’s to blame? In a recent piece at Fortune I went through the suspects to figure out how we got here.
*******
The housing market feels broken at the moment.
Prices skyrocketed 50% nationally over the course of the pandemic. Then mortgage rates went from sub-3% to more than 7.5% in a hurry as the Fed aggressively raised interest rates. And now supply is severely constrained because affordability is so poor and homeowners don’t want to give up their 3% mortgage. Housing affordability is as bad as it’s been in decades, and it’s hard to see what fixes things.
So who is to blame for this mess of a housing market?
It’s the baby boomers, according to economists at Barclays. In a recent note titled “Blame the Boomers,” housing strategists at Barclays wrote: “The U.S. housing sector is on the upswing again, even with mortgage rates at multi-decade highs. Although much has been attributed to shortages of existing properties and mortgage lock-in effects, we think strong demand is a symptom of the aging population.”
The gist of the argument here is the baby-boomer generation is so much larger than previous older generations, and once the kids are out of the house, they are now crowding out the housing supply.
There is some credence to this argument. Nearly 40% of all mortgages in this country are paid off free and clear. That’s mostly owing to baby boomers. They have substantial equity built up in their homes so they aren’t nearly as worried about high mortgage rates as young people.
Baby boomers are in a far better position than most potential homebuyers. According to Redfin, nearly one-third of all homebuyers are paying cash.
However, there are far bigger culprits than baby boomers for the broken housing market. Here they are in no particular order:
We need to build more housing
We simply haven’t built enough houses in this country to keep up with demand. The following chart shows how many millions of homes we have completed in this country by decade, going back to the 1970s:
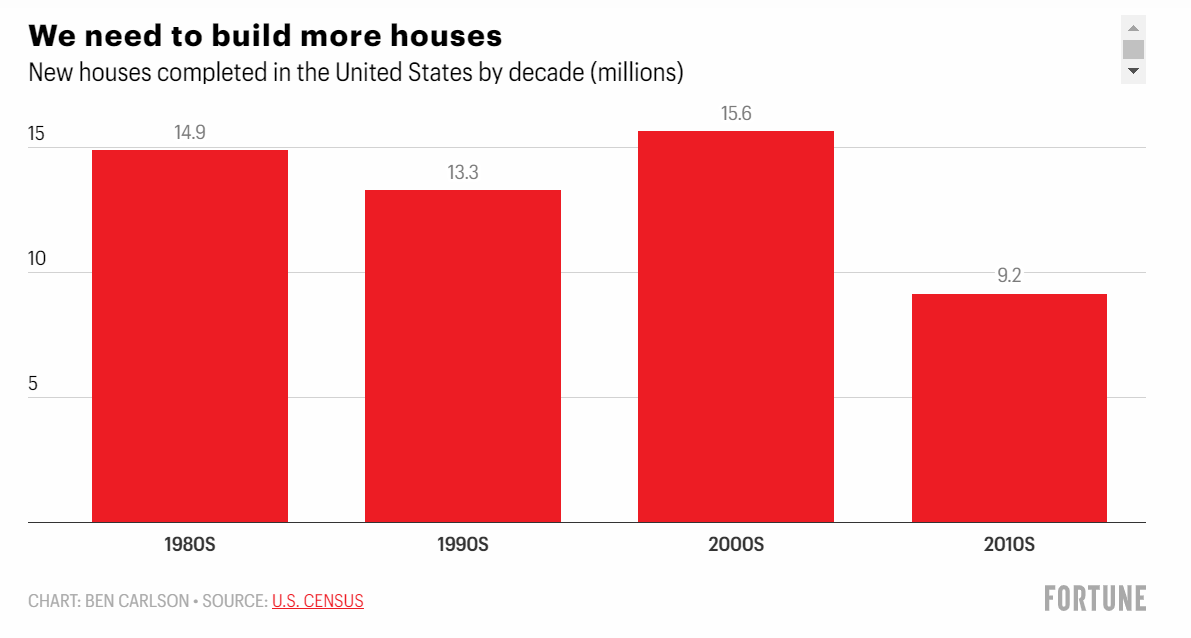
There was a massive drop-off in the 2010s. Obviously, homes completed in the ’70s, ’80s, and ’90s can still be lived in, but our population has grown in this time as well. In 1970, the U.S. population was roughly 200 million people. It’s now closing in on 340 million residents.
The good news is 4 million homes have already been completed in the 2020-22 period, so we’re off to a better start this decade. However, we still have a lot of work to do.
Zillow estimates we’re 4.3 million houses short of the current demand.
The Great Financial Crisis
One of the biggest reasons for the drastic drop-off in the number of new homes completed in the 2010s was the 2008 financial crisis.
Homebuilders went crazy building new homes during the housing bubble of the early-to-mid-2000s. But the housing bubble burst, and the number of new homes under construction fell off a cliff:
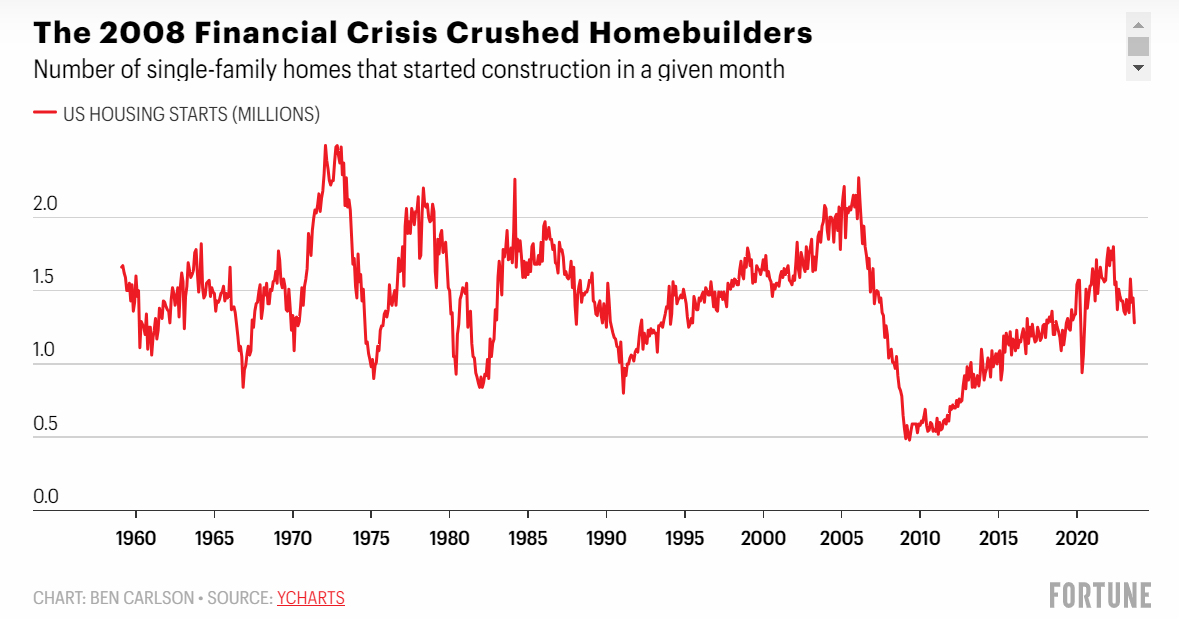
We went from an environment with too much supply to not enough, as housing prices crashed and homebuilders pulled back.
Homebuilders are still scarred from that boom-bust cycle and have been slow to expand as they did in the 2000s for fear of another downturn.
Unless the government incentivizes home construction, it’s hard to see us getting to the point where we build enough houses.
The Pandemic
Housing prices were relatively affordable for the entire decade of the 2010s from a combination of price declines from the housing bust and low mortgage rates. From 2010-19, national housing prices, according to the Case-Shiller U.S. National Home Price Index, were up 44% in total or 3.7% per year.
Since 2020, housing prices are up 44% in total or nearly 11% per year. We basically squeezed a decade’s worth of home price gains into a little less than four years.
The pandemic caused people to reassess their lifestyle. Remote work became an option for millions of white-collar workers. People who lived in high-cost-of-living areas could relocate to cheaper cities and work from anywhere.
Sprinkle in the highest inflation in four decades (housing prices tend to track the cost of building) and we’ve experienced the biggest housing bull market in history.
Demographics
Baby boomers might have the upper hand in housing wealth, but household formation by the biggest demographic in this country, millennials, is also causing the imbalance in supply and demand.
I know it may seem like young people are completely boxed out of the housing market, but Gen Z and millennials are more or less on track when it comes to owning a home (via Redfin):
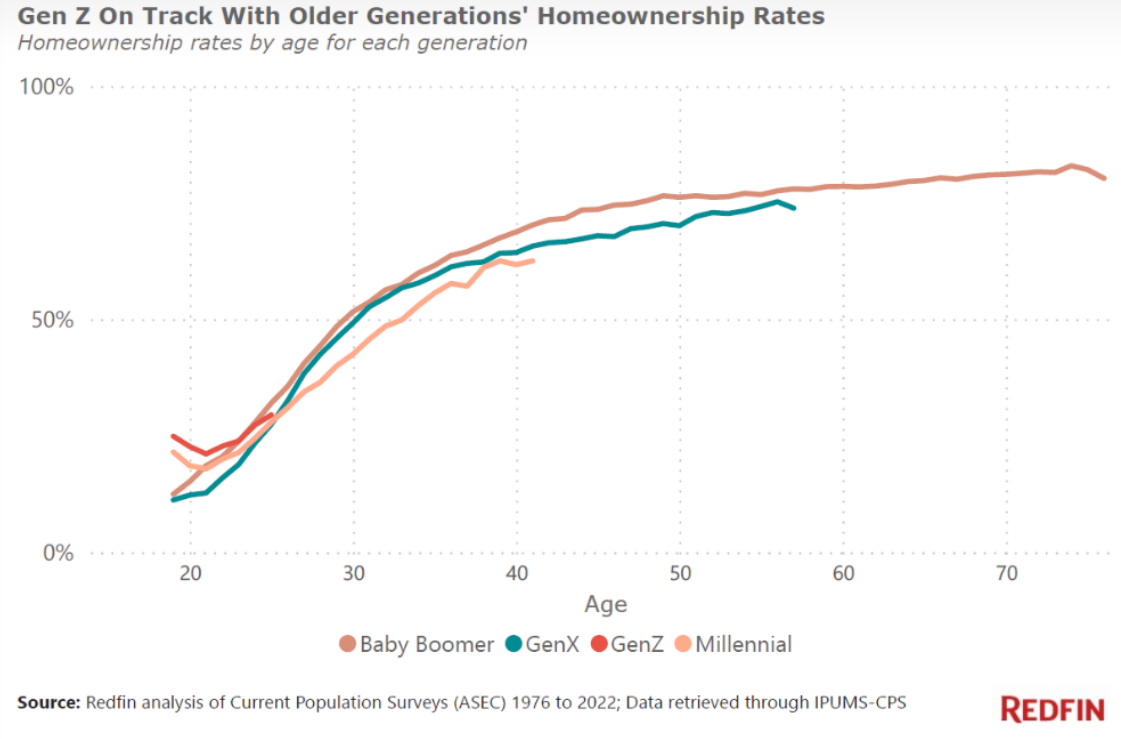
The homeownership rate for millennials is well over 50% and trending higher. This is what happens when people get older. They settle down, have kids, and move out of Mom and Dad’s basement.
And since there are more than 70 million millennials who are now in or approaching their prime household formation years, this number will continue to increase.
The problem for young people these days is there isn’t much hope for a quick fix in the housing market. It’s possible 8% mortgage rates will bring down housing prices eventually, but it’s certainly not guaranteed. And if mortgage rates do fall because the Fed cuts rates or the economy slows, it’s possible demand will actually pick up again because so many people have been waiting to buy a house.
The only good news for young people is eventually the baby boomer generation will pass down their homes or be forced to sell as they age.
The bad news is you could have to wait for the 2030s for this to happen in a meaningful way.
This piece was originally published at Fortune.

