The Federal Reserve has tracked household balance sheet data going back to 1952.
Each quarter they provide details on total financial assets and liabilities for households and nonprofit organizations.
This data doesn’t tell us where the economy is heading but it can help understand how Americans are generally positioned for whatever happens next.
As of June 30th this year, American households have their highest levels of assets, liabilities and net worth ever: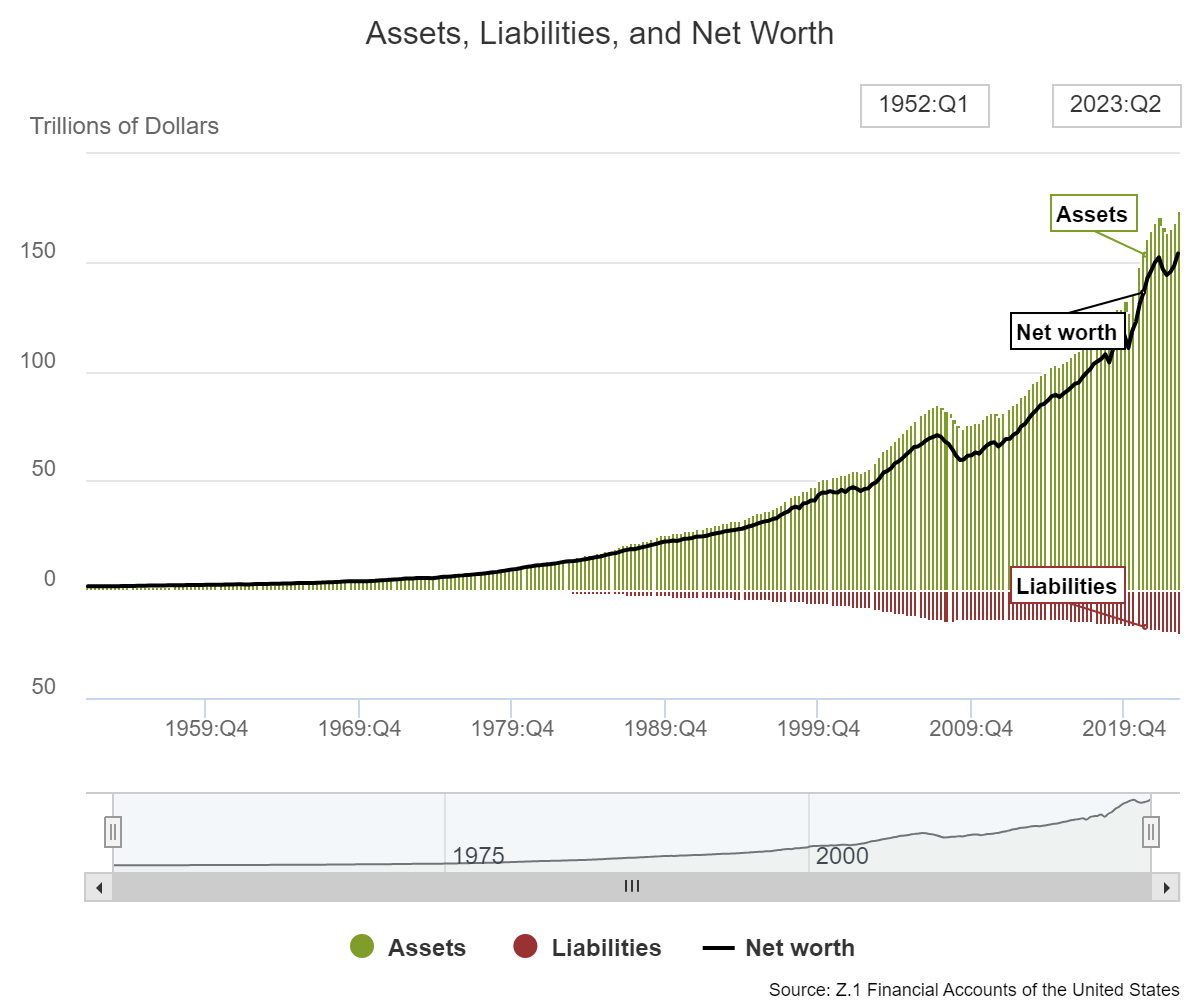
The totals are $174.4 trillion in assets, $20.1 trillion in liabilities and a net worth of $154.3 trillion.
That’s a lot of money.1
Here’s the breakdown of assets by financial (stocks, bonds, cash, etc.) and nonfinancial (nonprofits, consumer durables and real estate):
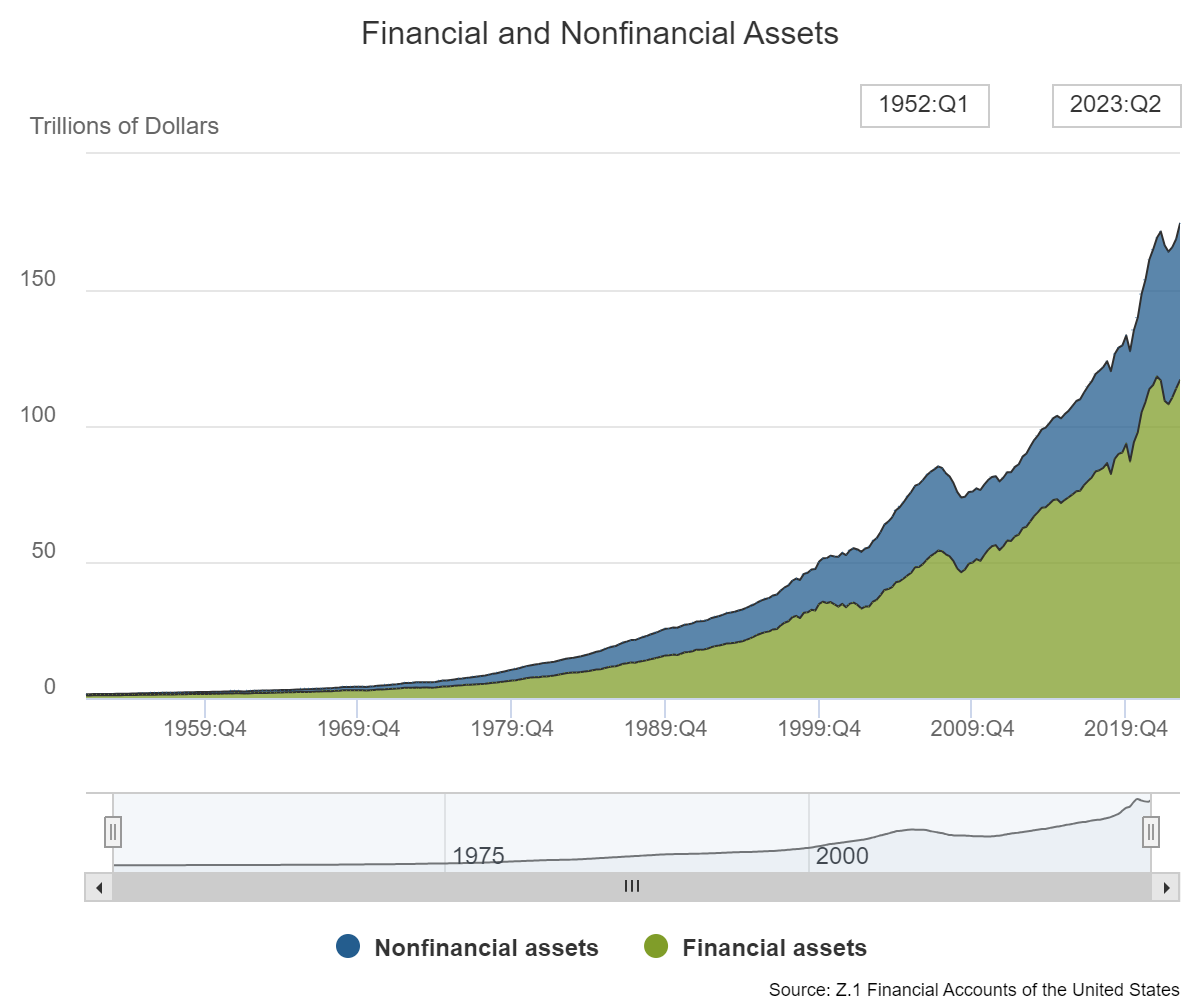
It works out to around two-thirds in financial assets and one-third in nonfinancial assets.
Mortgages make up the bulk of household debt:
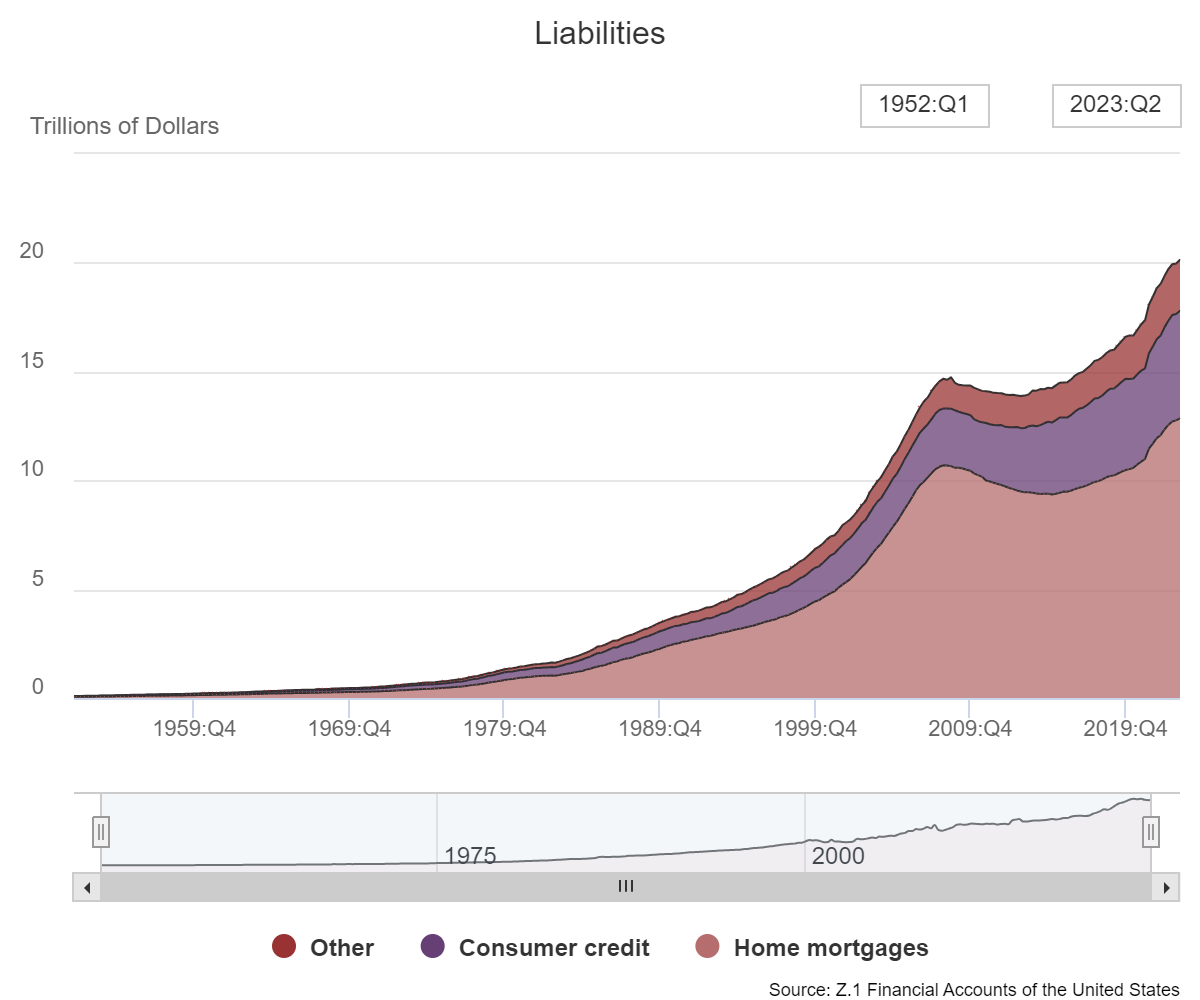
Housing debt makes up roughly 64% of total liabilities while consumer credit (car loans, credit cards, student loans, consumer loans, etc.) accounts for 25% of the total. Other types of debt are a little more than 11% of all liabilities.
The ratio of debt-to-assets is surprisingly stable over the decades although there are times when things have gotten out of whack.
The average debt-to-asset ratio historically has been around 13% (currently 12%), getting as high as 20% in 2009 at the depths of the financial crisis and as low as 6% in 1952 before consumer credit exploded higher in this country.
Looking at liabilities relative to disposable personal income can also put things into perspective:
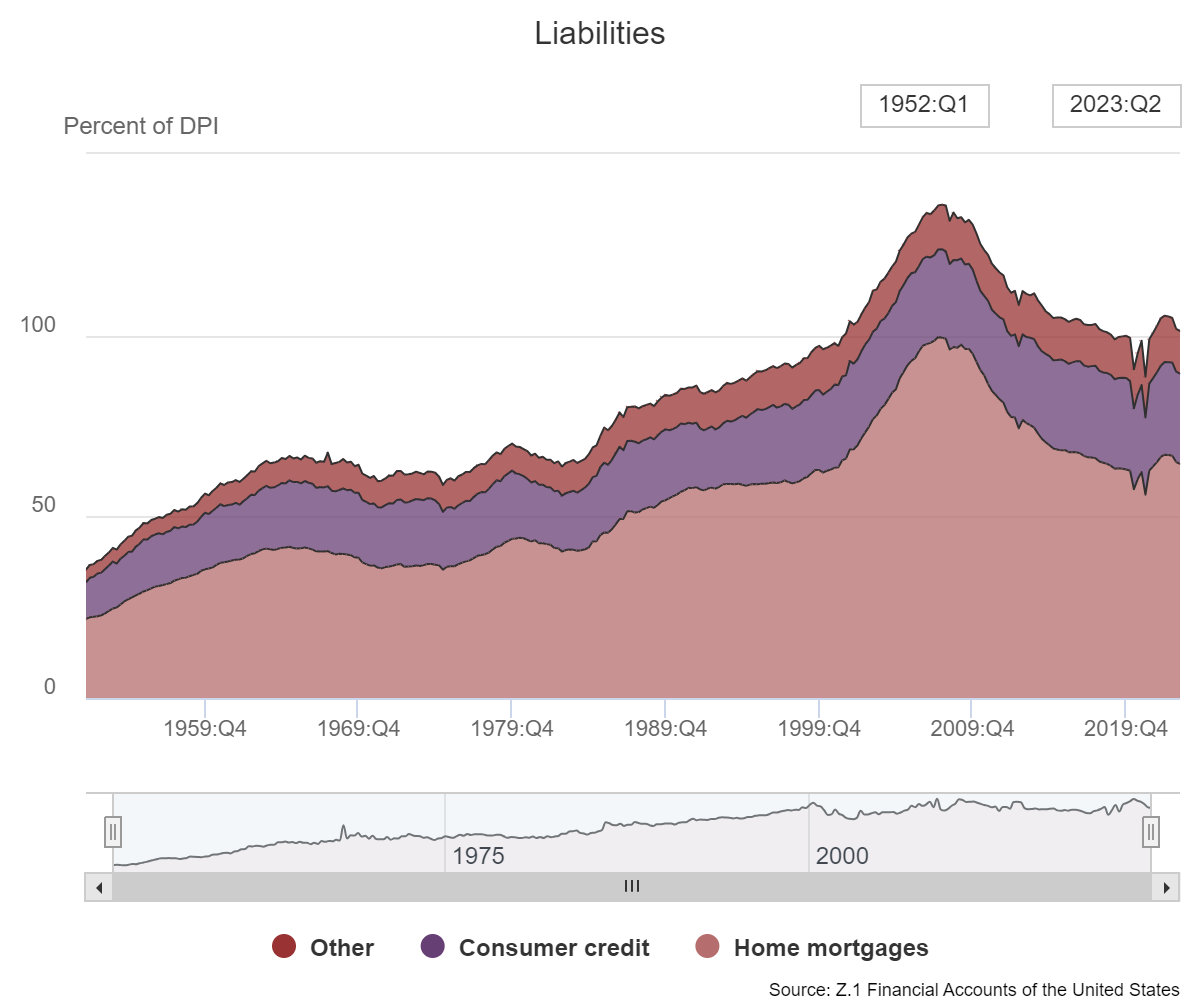
Debt was out of control in the run-up to the 2008 financial crisis. It’s now back down to levels from back in 2000.
The long-term trends in these numbers are interesting from a historical perspective but it can also be instructive to look at the changes during recent cycles to help explain how certain economic environments have played out.
For example, the 2001 recession was relatively mild.2 From 2001, when things bottomed out through the third quarter of 2007 (when things peaked before the Great Financial Crisis), total financial assets grew 64%.
That’s not bad until you consider total liabilities surged a whopping 94% in that same time.
There’s a reason the 2008 debacle was a debt crisis. People borrowed too much money.
Now consider the growth in both assets and liabilities since things bottomed out from the Great Financial Crisis.
Since the end of the second quarter in 2009, assets have grown by 136% while liabilities are up just 40%. Assets have soared by more than $100 trillion. Debt has expanded by $5.7 trillion.
This means net worth has swelled by almost 160% from the bottom of the GFC.
If you want to know why the economy has remained so resilient, look no further than repaired household balance sheets since one of the worst modern economic downturns in history.
Even if we look more closely at the recent pandemic cycle, asset growth has outpaced the growth in debt.
From the end of 2019, just before the pandemic broke out, financial assets have climbed 31% versus a 21% rise for liabilities.
This is not like the precursor to 2008. Not even close.
Does this mean households can keep the economy out of a recession for the foreseeable future? Not necessarily.
Sure, consumers make up 70% of the economy and most consumers are in pretty good shape. But it can’t last forever without consumer credit eventually creeping higher.
The spending boom from the pandemic can only last for so long.
And the stock market and housing market can’t possibly go up as much as they have. Even if we don’t see a market crash like people have been predicting forever and a day, the gains should at least level off at some point.
The good news is that households have a nice margin of safety right now. Home equity has grown from $19.4 trillion at the end of 2019 to more than $31 trillion now.
Not all household finances are created equal but collectively things are in a pretty decent place right now.
There is always a chance of something coming out of left field that throws a wrench into the economy. But consumers remain about as prepared as they’ve ever been for a slowdown.
Unless the economy shifts into another gear and overheats in the coming years, U.S. household balance sheets are in a pretty good place to weather a mild recession.
Consumers may even be the driving force that makes the next recession mild in the first place.
Further Reading:
How Rich Are the Baby Boomers?
1The latest Census estimate is there are around 132 million households in the U.S. if you want to put these numbers into perspective.
2The dot-com bust in the stock market was far worse than what happened in the economy. The recession lasted for just 8 months while GDP fell 0.3%. The unemployment rate did rise to 6.3% by the summer of 2003 but was back to 4.5% 3 years later.

