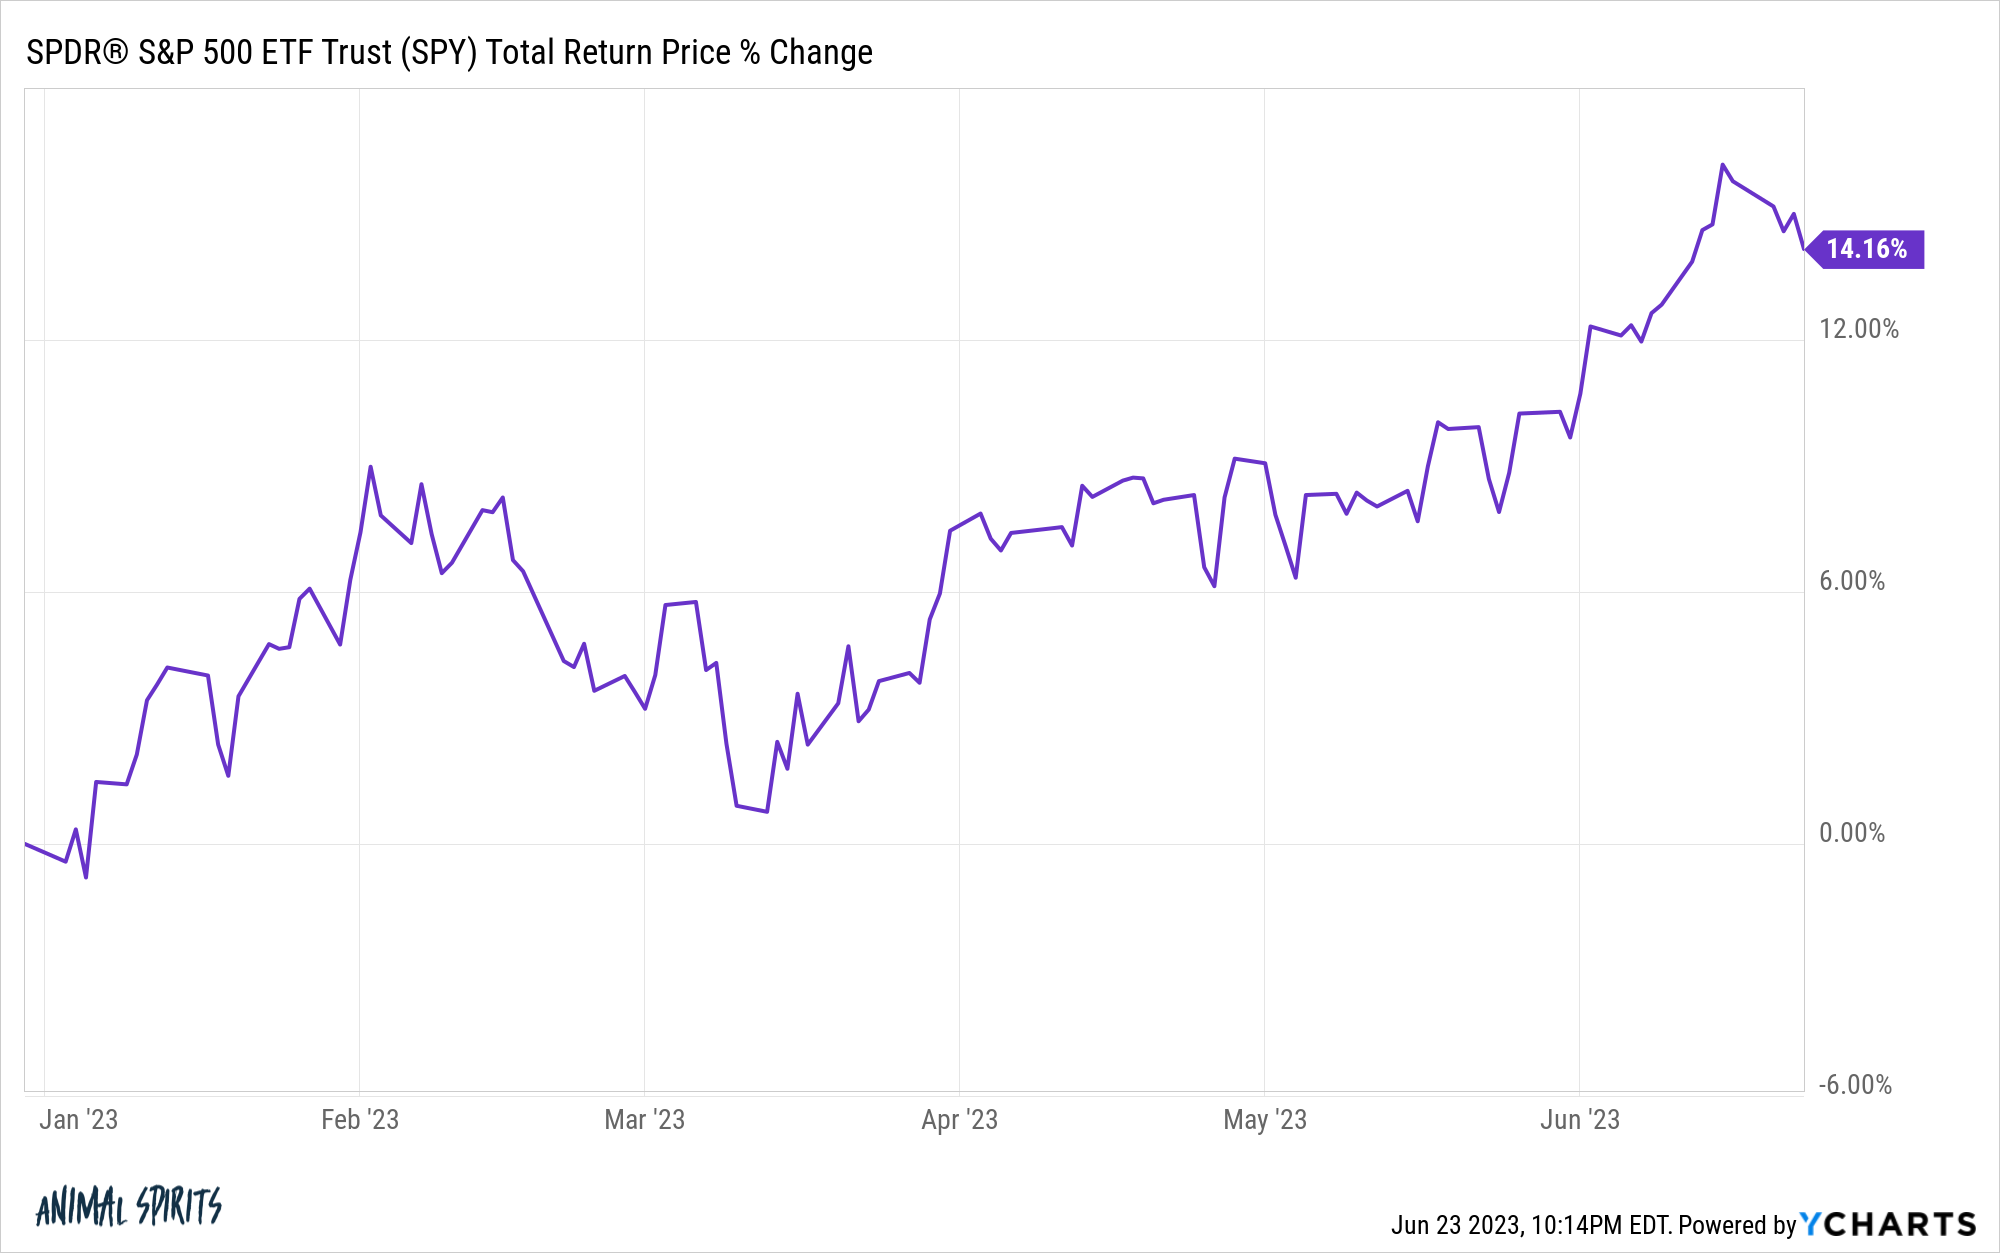
The S&P 500 is up more than 14% this year.
Not bad.
I was talking with a financial news reporter this week (not to brag) who asked me for some thoughts on where things go from here performance-wise for the rest of the year:
What do you think is more probable from here — stocks finish down on the year or up 20%?
My ability to predict short-term market moves is about as reliable as a Detroit Lions top 10 draft pick but no one can reliably forecast what the stock market will do next.
While no one can predict the future when it comes to the stock market, you can use historical returns to provide some context around a wide range of results.
Past performance is not indicative of future performance and all that but historical returns can help when it comes to setting expectations for how the stock market generally behaves.
For instance, when it comes to the question I was asked this week about the stock market finishing down or up 20% on the year, history says up 20% is a higher probability bet.
I ran the numbers on the calendar year return distribution for the S&P 500 from 1928-2022 and it looks like this:
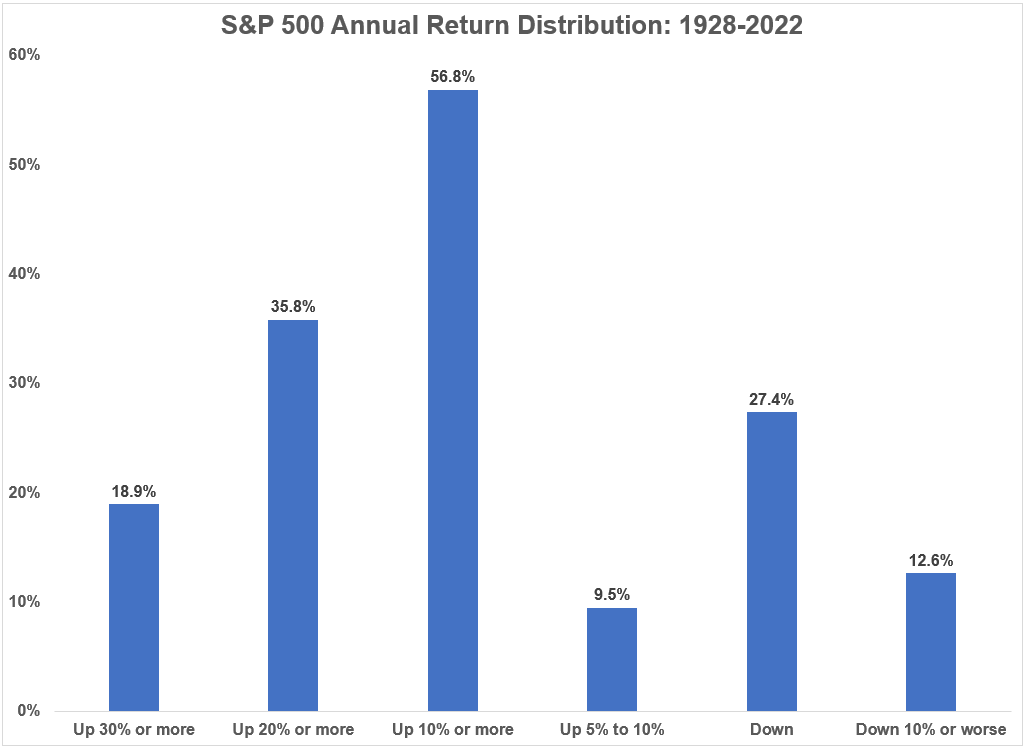
Here is a quick summary:
- Almost 6 out of every 10 years on the stock market has seen gains in excess of 10%.
- A little more than 1 out of every 3 years has been a return of 20% or more.
- Nearly 1 out of every 5 years was a 30% up year or better.
- Less than 1 out of every 10 years has seen a calendar year-end with gains in the 5% to 10% range.
- Around 1 of every 4 years has finished the year down.
- Roughly 1 out of every 8 years has been a double-digit down year.
The U.S. stock market has been more likely to finish the year up 20% or more than down on the year. That’s a pretty darn good track record.
Does this mean we should start popping bottles of champagne in preparation for a 20%+ year in 2023?
No.
The stock market is not a casino.
You can’t take historical probabilities to the bank. But I still think you can use historical returns to give yourself a range of possibilities, even if the future throws us some curve balls.
While big gains have been a higher probability bet historically than most investors probably imagine, large drawdowns also occur more often than some people assume.
Here is an updated look at the calendar year returns going back to 1928 along with the peak-to-trough drawdowns during those calendar years:
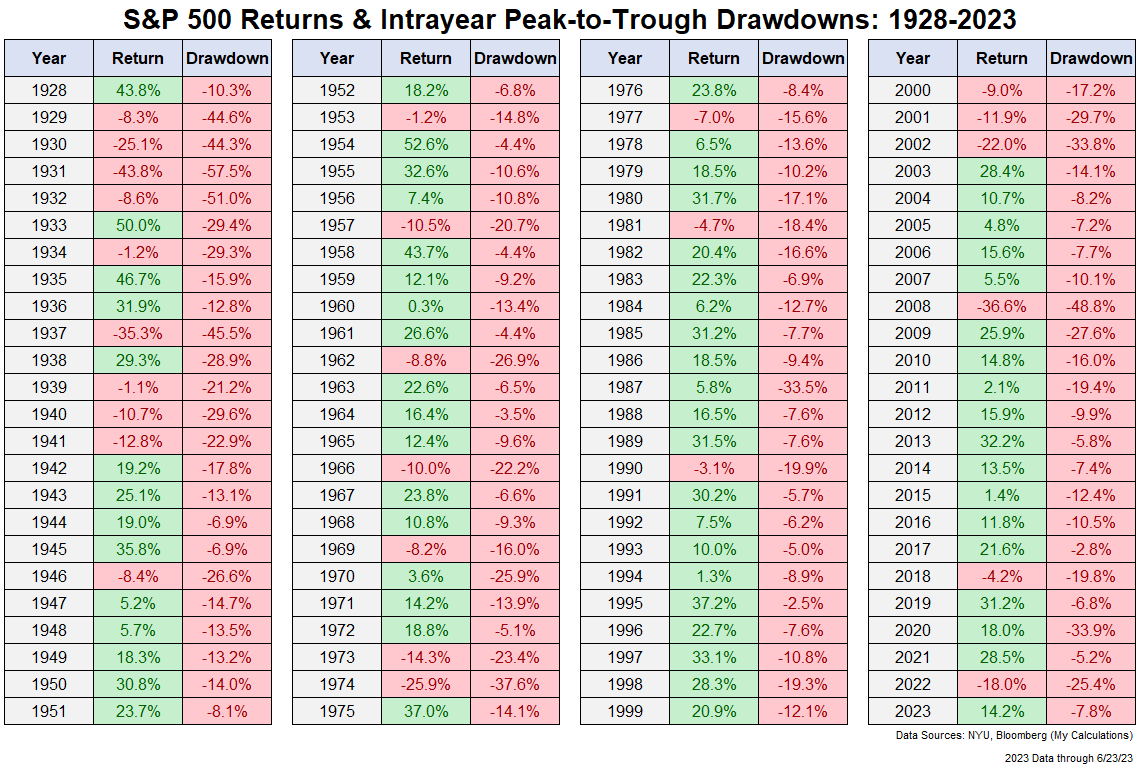
The average intrayear drawdown since 1928 is -16.4%. Things were downright nasty in the 1930s but even if we look at the numbers since 1950, we’re still looking at an average intrayear drawdown of -13.7%.
The U.S. stock market is a good deal this year (so far) so some investors might be surprised to learn that we’ve already experienced a drawdown of almost 8% this year (in February and March).
Could it get worse than that from current levels?
Of course it could.
Nearly 60% of all calendar years have ended up with gains of 10% or more but 6 out of every 10 years have also experienced a peak-to-trough drawdown of 10% or worse.
So if we’re setting baselines here, you should expect to see both double-digit gains and double-digit losses in most years.
Those years haven’t always overlapped but this is one of the reasons investing in stocks can be so challenging.
Big gains and big losses are both par for the course, meaning the stock market is constantly toying with your emotions.
I honestly don’t know what happens next from here.
But history shows we should expect the possibility for both big gains and big losses.
I know that’s not all that helpful if you’re trying to guess what comes next but it’s important to remind yourself on occasion how the stock market generally functions.
Further Reading:
The Stock Market is Not a Casino

