Last week I asked if the bear market is over.
Gun to my head, yes, but I don’t make very good predictions when firearms are aimed at my dome.
If the bear market is over, does that mean we’re in a new bull market?
Could be.
The S&P 500 was down 25% from peak to trough. And the market is now up more than 20% from the lows:
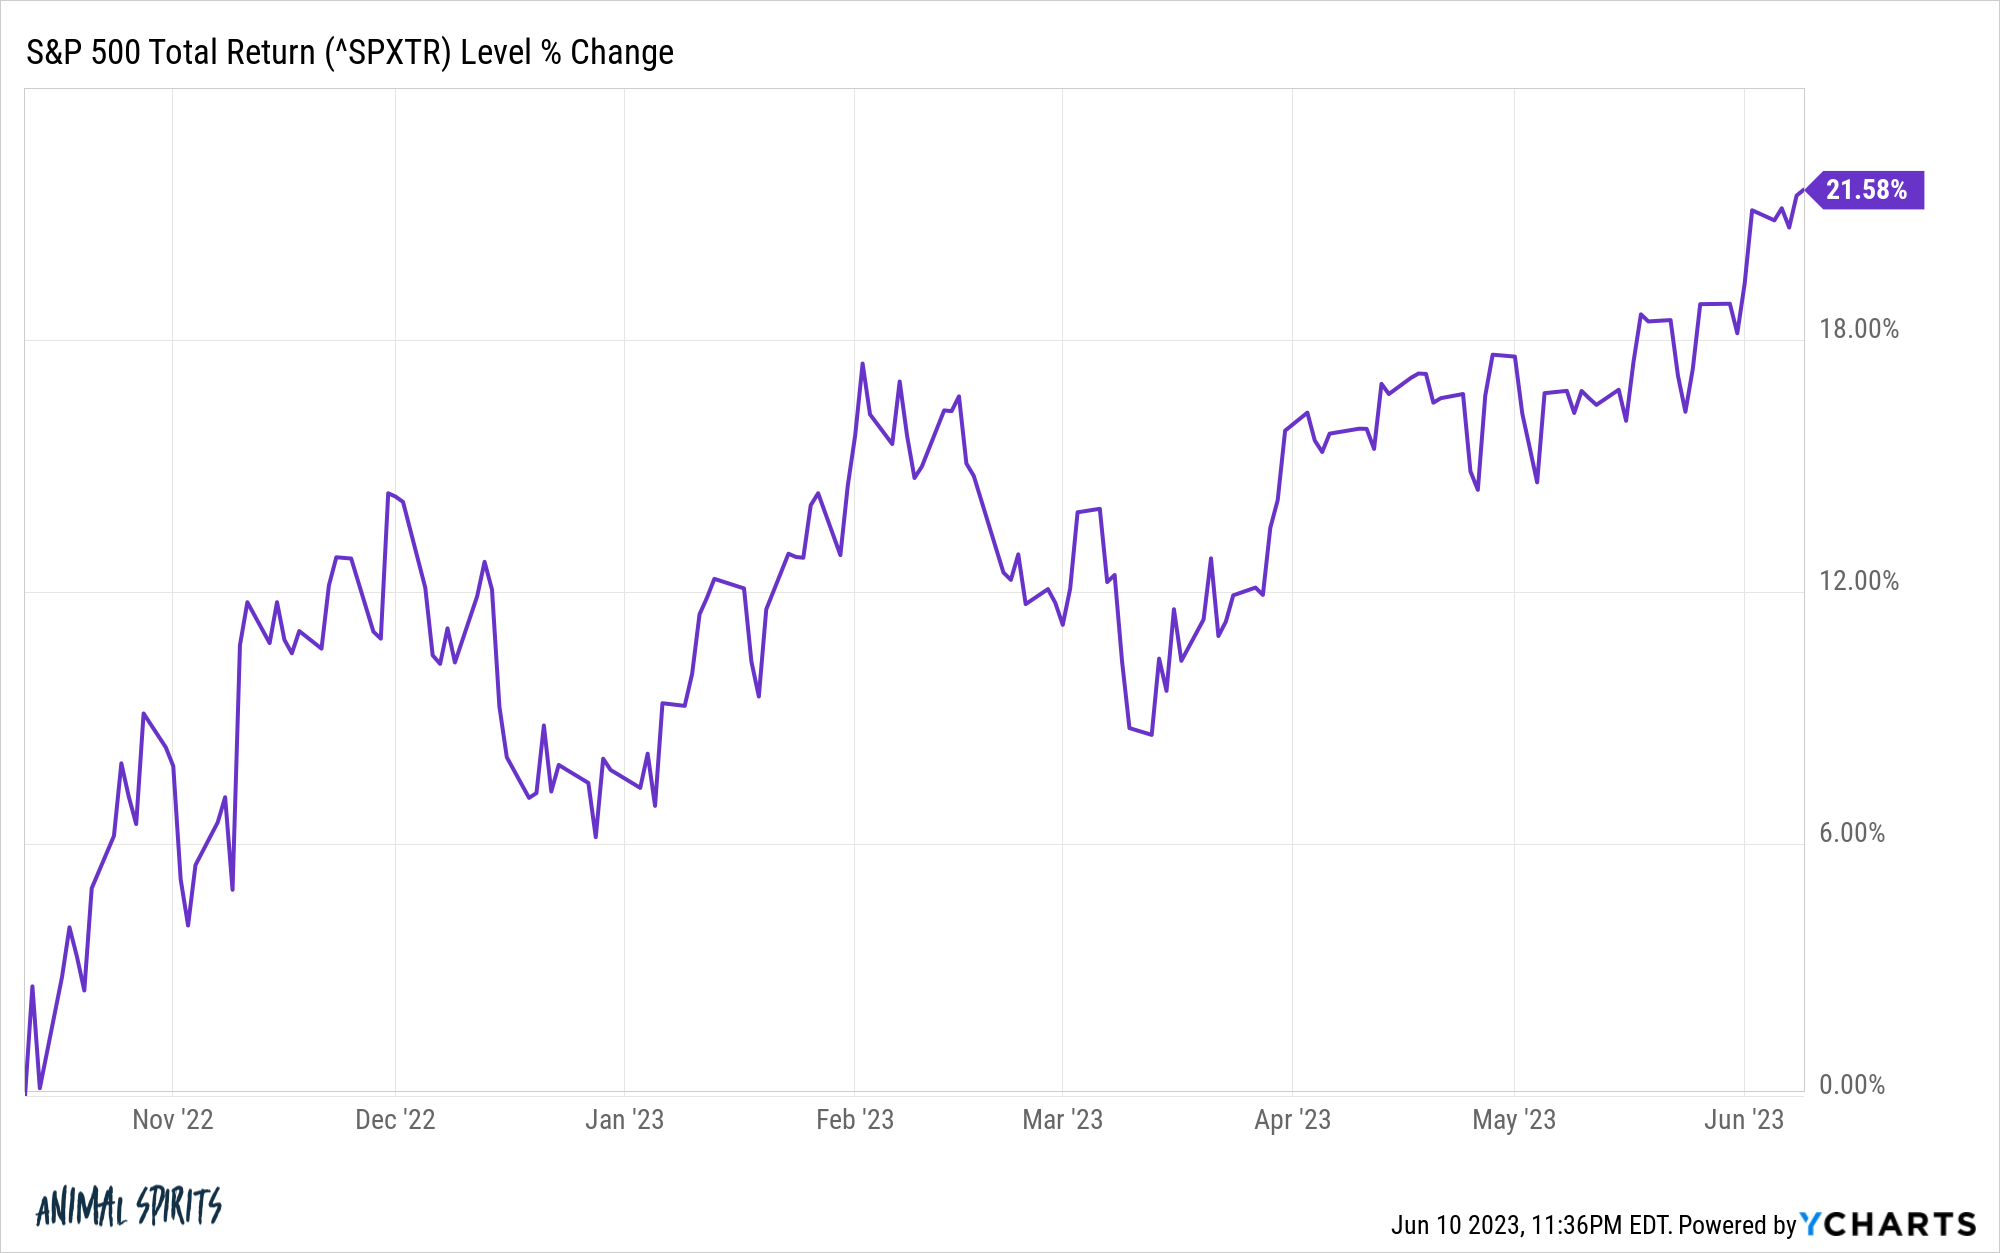
Technically that’s a bull market if we’re using 20% labels here.
This may seem like semantics but there are cyclical and secular bull markets.
Cyclical bull markets are shorter in length and magnitude. Secular bull markets are longer in length and magnitude.
I would love to tell you this is a new secular bull market that will last for years and years but there is one economic data point that gives me pause — the unemployment rate which is still close to historically low levels.
Many historical market relationships have been turned on their head since the pandemic but there has been a clear correlation between stock market returns and the unemployment rate over the past 75 years or so.
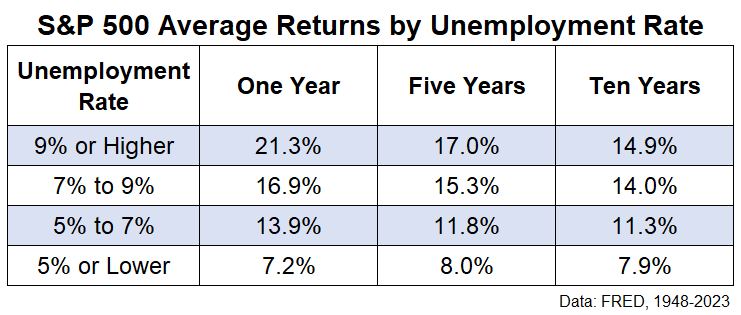
These are the ensuing 1, 5 and 10 year average returns from starting unemployment rates since 1948:
Here’s the chart version for our visual learners:
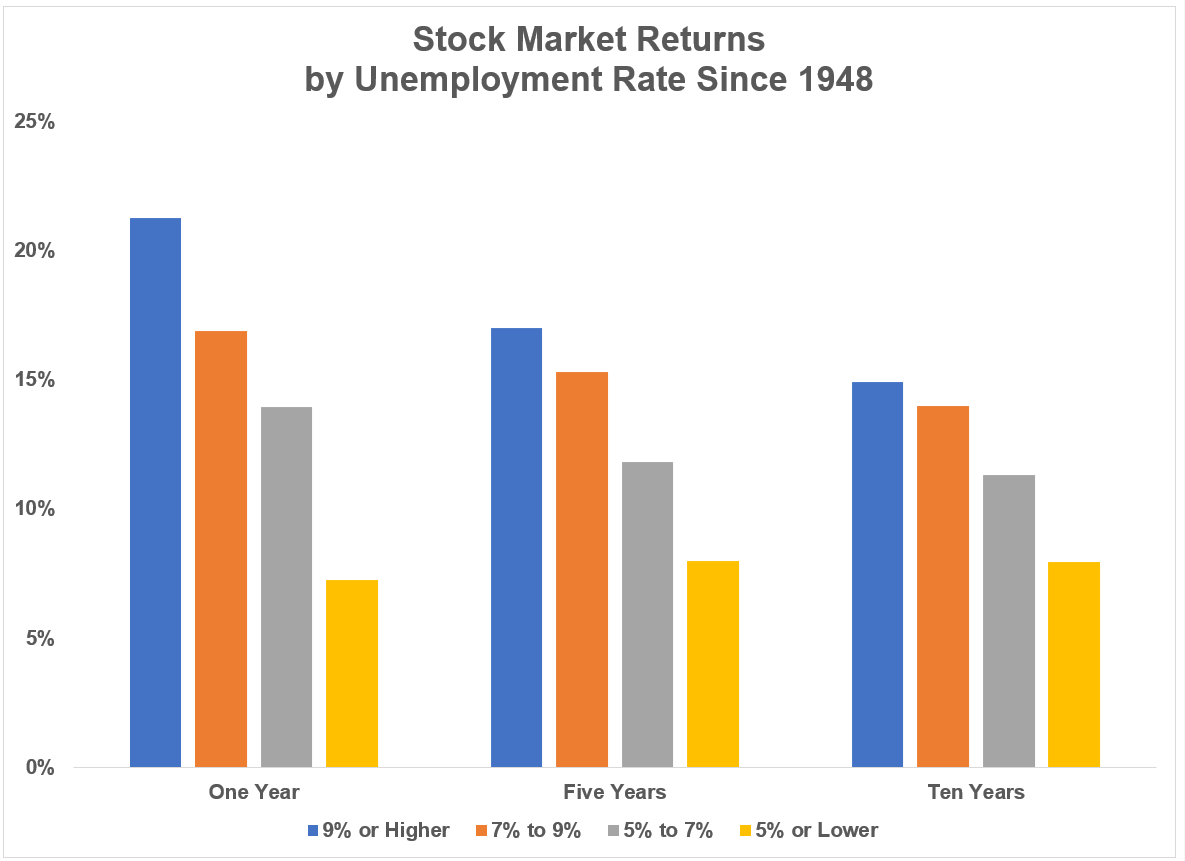
There is a clear pattern in these results.
Average annual returns have been higher from higher unemployment rates and lower from lower unemployment rates.
There are always outliers when it comes to averages but these numbers make sense when you consider the economic environments that occur during the different unemployment rate ranges.
When the unemployment rate has been high historically, that has typically coincided with a recession which also tends to be accompanied by a bear market.
Buying stocks when the unemployment rate is high and things look bleak economically speaking has been a wonderful strategy in the past. Buy when there is blood in the streets and all that.
And low unemployment rates have typically coincided with economic boom times which tend to be accompanied by bull markets. Be fearful when others are greedy and so forth.
The bizarre thing about the most recent bear market is that it happened without a commensurate spike in the unemployment rate. In fact, when the bear market began in January of 2022, the unemployment rate was 3.9%. Today it’s 3.7% and got as low as 3.4% over the past year-and-a-half.
It is worth noting the unemployment rate has been lower than 7% nearly 80% of the time since 1948. It’s only been 9% or higher 6% of the time.
So it’s not like you get a lot of opportunities to buy stocks when they’re a screaming buy based on the economy.
It’s also worth pointing out that it’s not like returns are terrible from current levels of unemployment. They’re just a touch below average.
It can also be instructive to look at the range of returns around these historical averages. Here those are for 10 year performance:
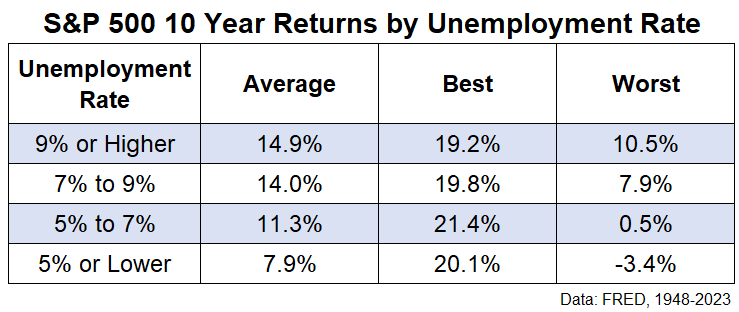
You can have exceptional long-term returns from low unemployment rates. It’s just that you get a much higher floor investing when the economy is falling apart than when everything is humming along from a labor market perspective.
Markets are often counterintuitive. Historical relationships are helpful for setting expectations but they’re not written in stone.
So we could get a rip-roaring bull market from an unemployment rate of 3% or so but it’s probably not the base case.
Further Reading:
Is the Bear Market Over?

