I have a love-hate relationship with historical market data.
On the one hand, since we can’t predict the future, calculating probabilities from the past in the context of the present situation is our only hope when it comes to setting expectations for financial markets.
On the other hand, an overemphasis on historical data can lead to overconfidence if makes you believe that backtests can be treated as gospel.
In some ways markets are predictable in that human nature is the one constant across all environments. This is why the pendulum is constantly swinging from manias to panics.
In other ways markets are unpredictable because stuff that has never happened before seems to happen all the time.
I like the old saying that I would rather be roughly right than precisely wrong.
Historical market data doesn’t tell you what’s going to happen when it comes to investment outcomes but it can help you understand a wider range of potential risks.
It can also show you the magic of compounding when it comes to the stock market if you get too caught up on the risk side of the equation.
YCharts has a tool called Scenario Builder that allows you to look at the impact of investments, contributions and withdrawals on different holdings and asset allocations over time.
Here’s a simple one:
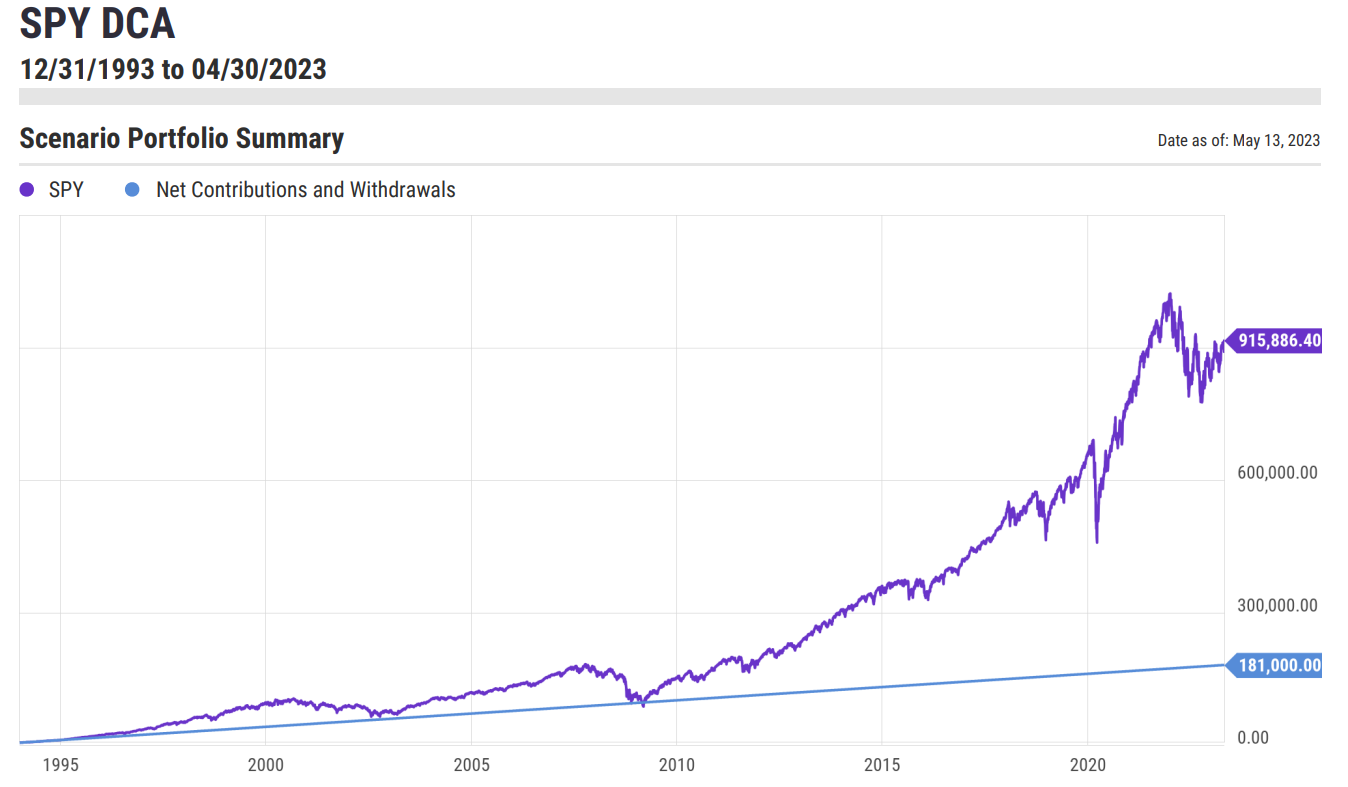
Let’s say you put $5,000 into the initial S&P 500 ETF (SPY) right around when it started at the beginning of 1994. On top of that you also contribute $500/month into the fund.
Simple right?
Here’s what this scenario looks like:

Not bad.
This is the summary:
- Initial investment (start of 1994): $5,000
- Monthly investment: $500
- Total investments: $181,000
- Ending balance (April 2023): $915,886
Plenty of volatility along the way but this simple dollar cost averaging strategy would have left you with a lot more money than you initially put into it.
Even though things worked out swimmingly by the end of this scenario there were some dark days along the way.
You can see on the chart where the purple line dips below the blue line in 2009 by the end of the stock market crash from the Great Financial Crisis.
By March of 2009 you would have made $96,000 in contributions with an ending market value of a little more than $94,000.
So that’s more than a decade-and-a-half of investing where you ended up underwater.
It wasn’t prudent but I understand why so many investors threw in the towel in 2008 and 2009. Things were bleak.
Everything worked out phenomenally if you stuck with it but investing in stocks can be painful at times.
A lost decade sandwiched between two bull markets with a sprinkle of a bear market toward the end worked out nicely using these assumptions.
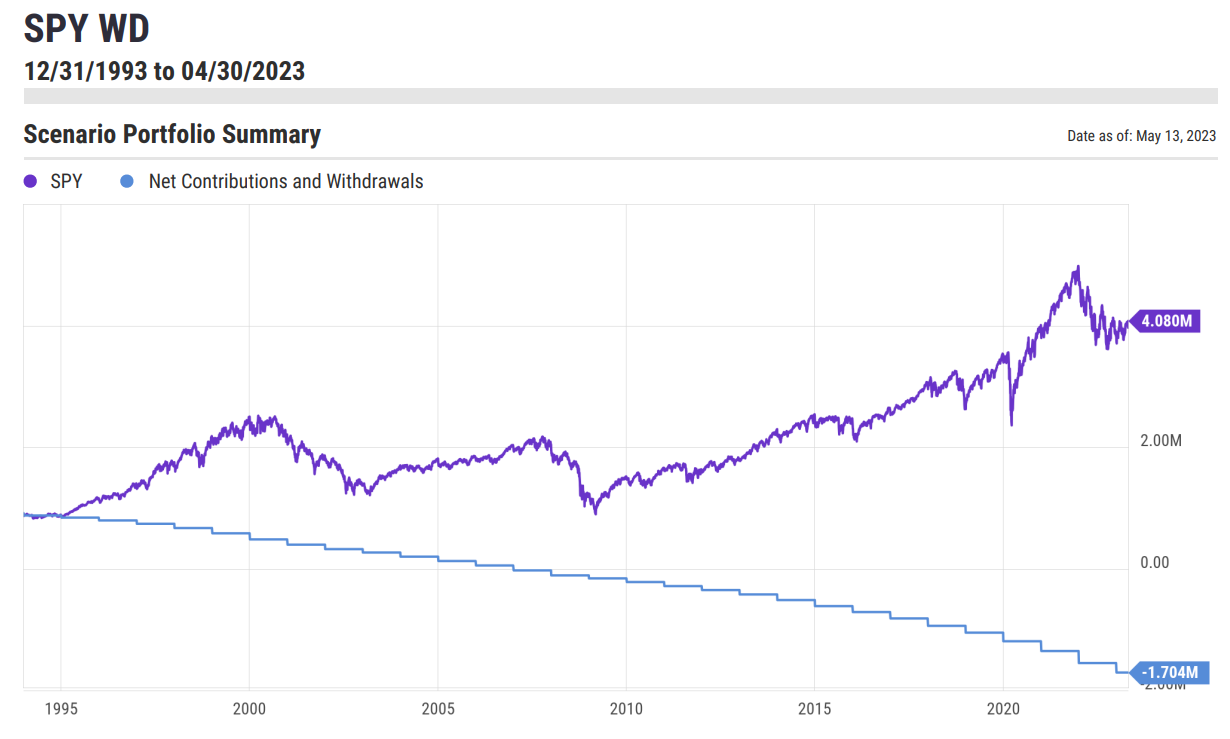
Just for fun, let’s reverse this scenario to see what would happen if you started out in 1994 with the same ending balance but now you’re taking portfolio distributions.
Like this:
- Initial balance (start of 1994): $915,886
- Annual portfolio withdrawal: 4% of portfolio value
I know this isn’t exactly the 4% rule since the 4% rule assumes you set the initial draw at 4% and then increase that amount by some inflation rate. But we’re just having fun here to see how things look using different assumptions.
Here’s the chart:

An ending balance of more than $4 million while spending $1.7 million along the way from a starting point of a little less than $1 million is pretty, pretty good.
The usual caveats apply here — past performance says nothing about future performance, no one actually invests in a straight line like this, no one invests in a single fund like this, no one uses this type of withdrawal strategy in retirement nor do they invest 100% in stocks while doing so, etcetera, etcetera, etcetera.
But I do like the idea of trying things on for size when it comes to stuff like this.
Life never works out like a spreadsheet or retirement calculator or scenario analysis tool.
Things change. People make or spend more or less money. Markets, contributions or withdrawals never occur in a linear fashion.
Life is lumpy. Finances change. Risk appetite evolves. Things become complicated.
But it’s not a bad idea to map things out a little when it comes to your portfolio, budget, savings, spending or anything in between.
The future never turns out exactly like you think it will but there is nothing wrong with setting some goalposts and then performing course corrections along the way as reality comes in better or worse than expected.
Every investment plan should involve setting expectations and thinking through scenarios that may or may not actually happen.
This is why financial planning is a process and not an event.
You have to be willing to update and evolve when things work out better or worse than expected.
Further Reading:
Backtests are Unemotional. Humans are Not
