Unless we get a Christmas miracle, the U.S. stock market is going to finish the year with double-digit losses.
If this downturn holds, it would be the 12th time in the past 95 years this has happened.
So it’s relatively rare but not completely out of the range of possibilities.
There’s nothing special about calendar year returns. It’s not like market cycles die on December 31st and are born again each year on January 1st.1
But you also can’t predict what’s going to happen in a given year based on what happened in the previous year. Markets are not that easy.
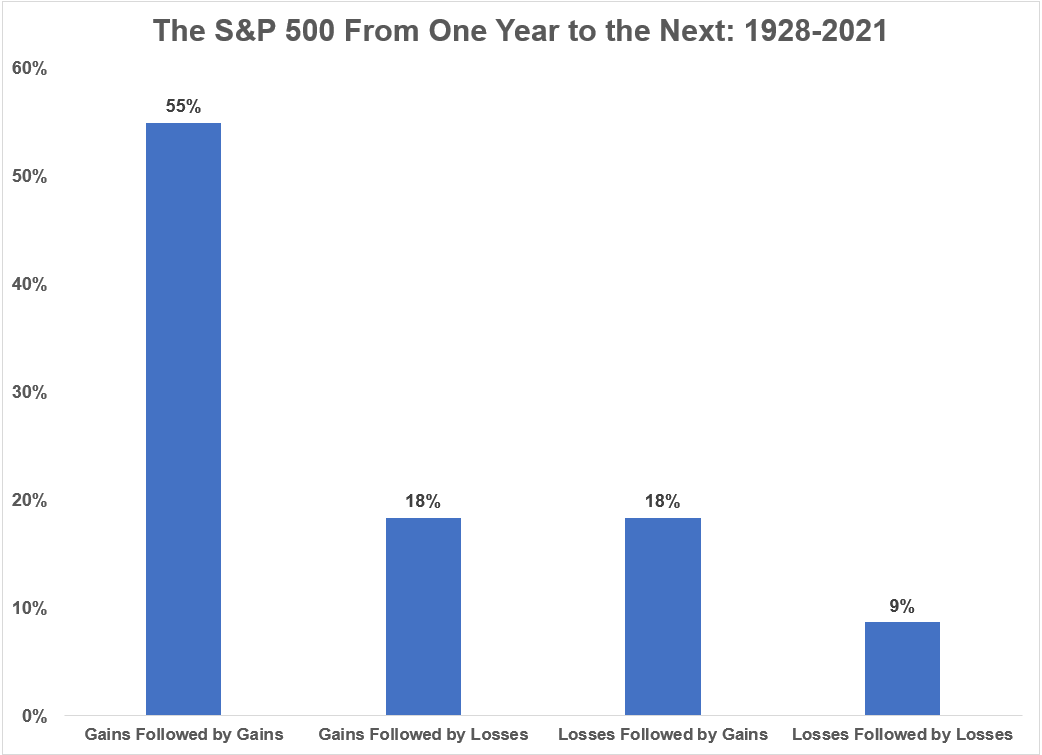
Since 1928, the S&P 500 is up roughly 55% of the time following a year that preceded it with a gain. This makes sense when you consider the market is up around 3 out of every 4 years on average.
The stock market has been down following an up year 18% of the time. It was also up 18% of the time following a down year.
That leaves just 9% of the time when stocks were down one year and then down the next year for consecutive losses.
You can see from the yearly returns that the losses do cluster at times but not all that often:
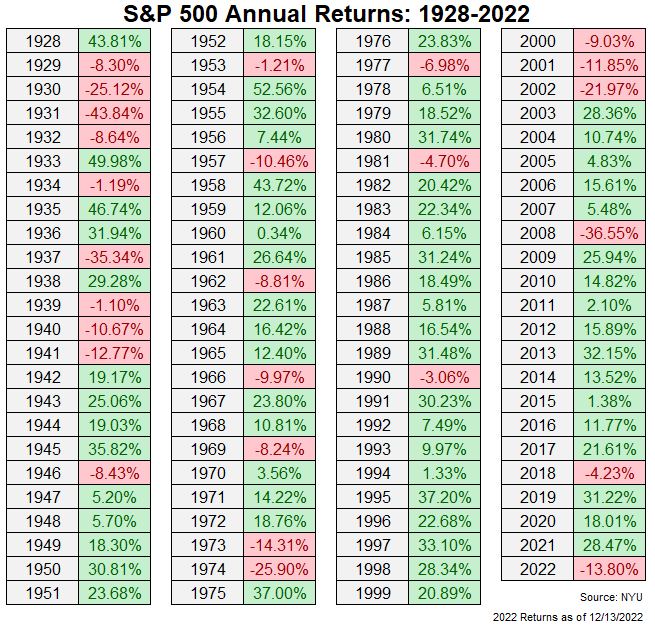
There were 4 down years in a row from 1929-1932. The market was down 3 years in a row from 1939-1941. It didn’t happen again until back-to-back down years in 1973 and 1974.
The last time the stock market posted a string of bad years was in the 2000-2002 bear market when each year it fell more than the previous year.2
From an investor psychology standpoint, a prolonged bear market is probably more difficult to stomach than a severe crash that ends in short order.
For example, most investors would prefer we finish this year down 30% and move onto a new bull market rather than sit through a down 15% year in 2022 and another down 15% in 2023.
I suppose the risk of this occurring is one of the biggest reasons stocks have a return premium to other asset classes in the first place.
Consecutive down years in the bond market are even more infrequent than the stock market:
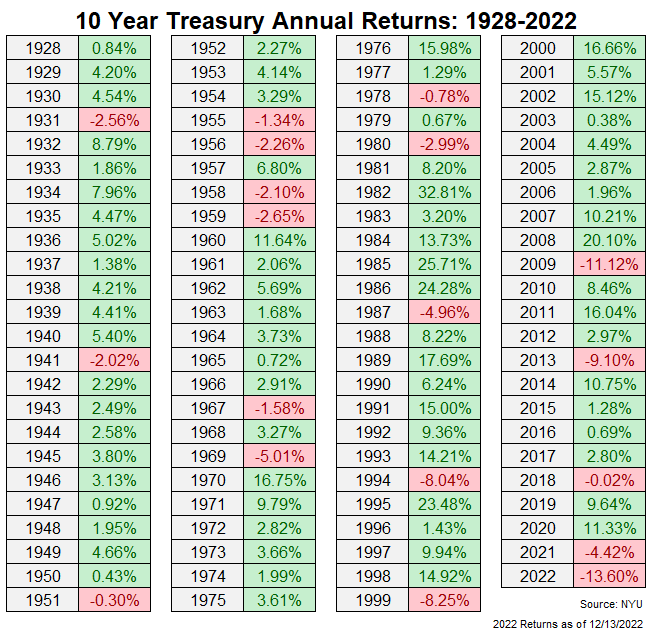
In fact, before back-to-back down years in 2021 and 2022, the only other time this has happened in the past nine-plus decades was in 1955-1956 and 1958-1959 (which coincidentally was another time when rates rose from a low starting point).
Shockingly, if it holds, 2022 would be the worst year for 10 year treasuries in modern financial market history. The only other time we witnessed a double-digit loss on the benchmark U.S. government bond was in 2009.
If you want to look at the bright side of things from a diversification perspective, there has never been a period where both stocks and bonds were both down in consecutive years at the same time.3
I don’t know what’s going to happen to stocks or bonds next year. The fact that both are down big this year could mean next year is a good one for financial markets.
But short-term returns are promised to no one. It’s not out of the realm of possibility for markets to have a handful of bad years in a row.
Most of the time good stuff happens in the markets.
But sometimes bad stuff happens too.
To survive over the long-run you need to make sure you bake both outcomes into your expectations.
Further Reading:
This Year Could Have Been Worse For Investors
1Although that kind of did happen in 2022. The stock market hit a new all-time high on January 3, the first trading day of the year and has been in a state of drawdown from that level ever since.
2This might just be a starting/ending point thing but it’s kind of crazy there wasn’t a single double-digit down year from 1975-2000.
3Fingers crossed I didn’t just jinx that streak.

