Think back to 2010.
After you got done signing up for some new app called Instagram and finished 17 shows and movies about vampires, maybe you finished reading The Girl With the Dragon Tattoo trilogy.
Once all that pop culture consumption was done, you would have needed some non-fiction to keep up with the intellectual crowd so you moved on to The Big Short by Michael Lewis.
Everyone knew the 2008 crisis was a doozy while we experiencing it but reading Lewis’s book made it seem even more ridiculous.
Hearing the vivid stories about subprime bonds, lax lending standards and over-the-top mortgage broker conferences was a stark reminder of just how crazy the real estate boom and bust was.
Now imagine future you travels back in time via Doc Brown’s Delorean from the year 2022 but only wants to talk markets with your former self (just go with it).
The 2010 version of you would likely ask the following:
Surely we had a double-dip recession in 2010 or 2011, right?
And the stock market went nowhere for years because the CAPE ratio was too high?
And the Euro probably collapsed from their debt crisis?
And the housing market is probably still digging out of its hole?
Actually…the only recession we’ve had since then was basically man-made because of the pandemic, the Euro is still hanging in there and the U.S. stock market is sitting on double-digit returns:
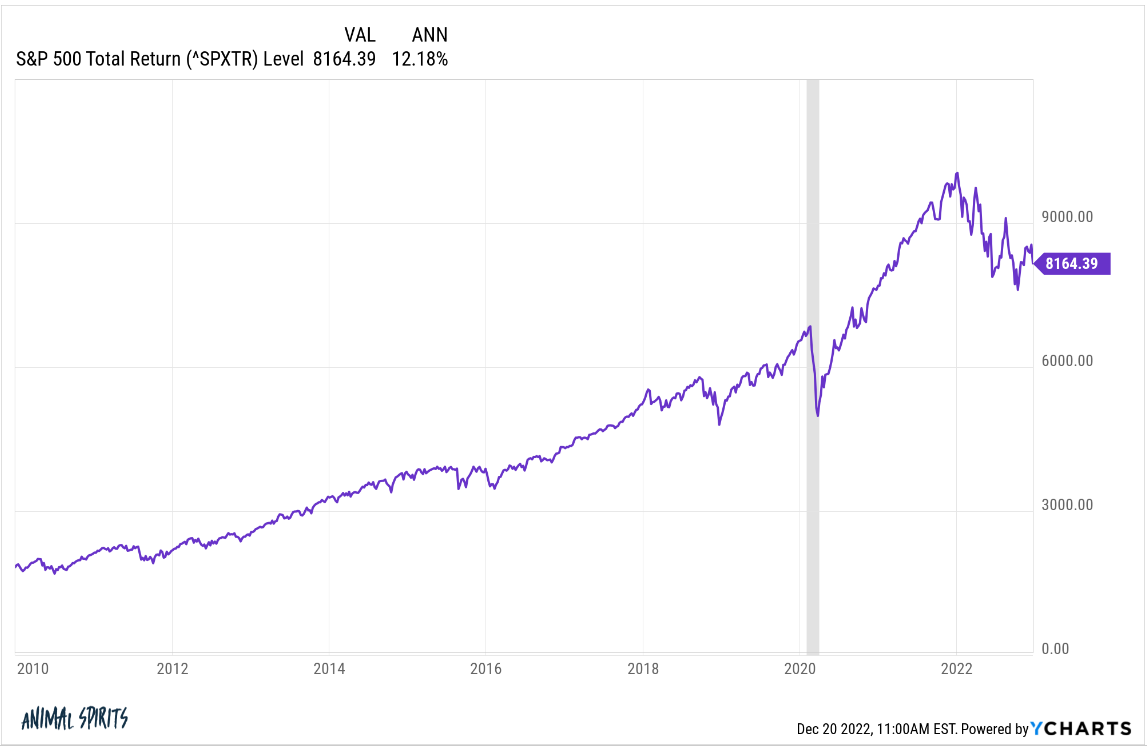
Just like no one thought it was possible for the stock market to get cut in half twice in the same decade in the 2000s, I’m not sure anyone was predicting a lengthy bull market in the aftermath of the financial crisis.
But what’s occurred in the housing market might be even more surprising to someone whose knowledge of the markets is capped at 2010 levels.
Just look at this chart from the Wall Street Journal on home equity vs. mortgage debt:
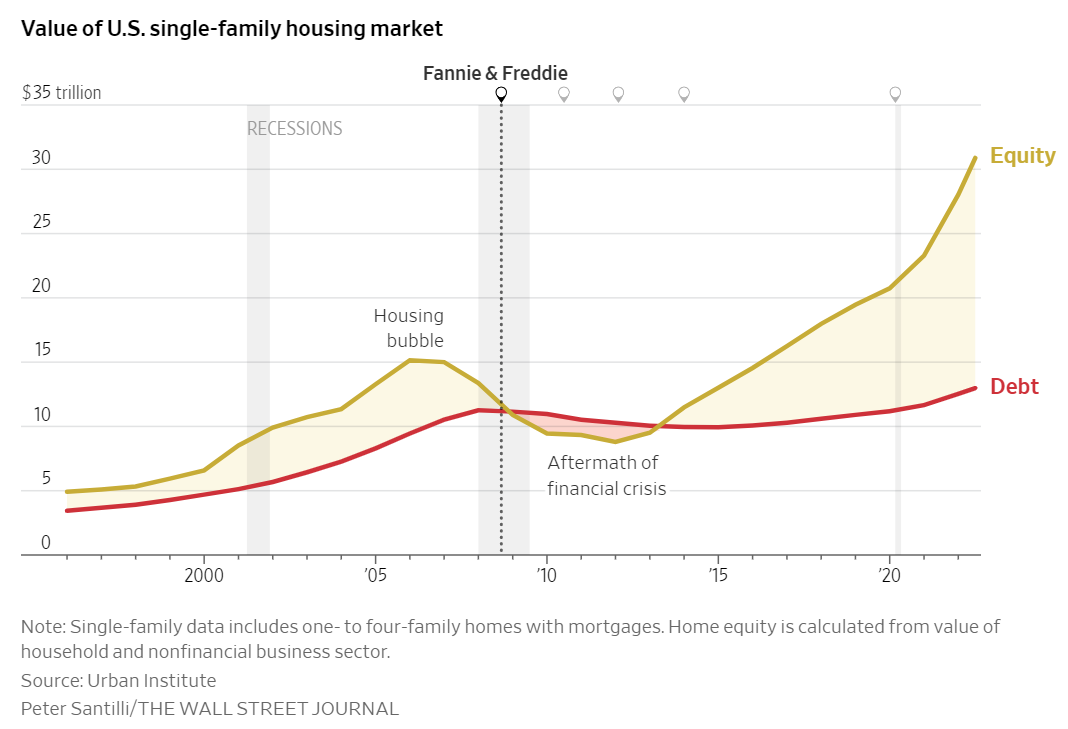
It makes the housing bubble look quaint by comparison.
At the peak in the mid-to-late 2000s the equity in people’s homes was around $15 trillion while mortgage debt stood at $9 trillion or so. That flipped once the bubble burst and a lot of homeowners were underwater.
Now we’re talking about home equity at well over $30 trillion while mortgage debts have increased to roughly $12 trillion. That is a massive spread, unlike anything we’ve ever seen.
It makes sense why it happened when looking back in hindsight — ultra-low interest rates, the pandemic, the ability to work from anywhere, millennial household formation, etc.
But no one in their right mind would have believed this could have happened while housing prices were crashing at the start of the last decade.
The big run-up in housing prices combined with a big run-up in mortgage rates has a lot of people worried about a repeat of the last housing crash.
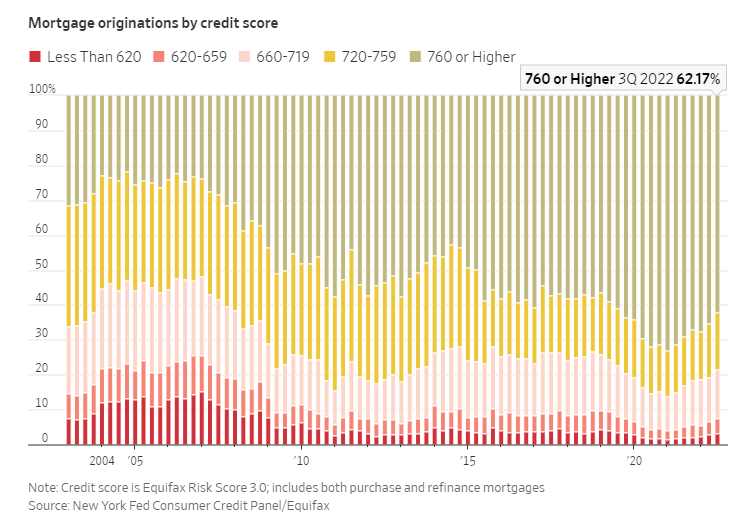
While the gains were larger this time around, the speculation wasn’t nearly as rampant. Homebuyers had better credit scores. They took on mortgage debt with lower borrowing costs. There were no exotic subprime NINJA loans being given out to people taking on adjustable-rate mortgages.
The Journal calculated what it would look like for housing price losses this time around in terms of getting to the same number of underwater homeowners:
A 28% decline in U.S. home prices between 2006 and 2009 sent the value of some 11 million homes below their mortgage balances, triggering widespread defaults, a near-collapse of the financial system and a deep recession. Home prices would have to fall between 40% and 45% from their peak to put the same proportion of mortgaged homes underwater today, according to a CoreLogic analysis.
Home prices can (and probably should) fall more from here. I have a hard time believing homeowners would ever willingly sell their homes at prices 40-45% lower than the peak but I have no idea what the right number is.
I’m not going to try to forecast what comes next with housing prices because there are so many unknown future variables — mortgage rates, the unemployment rate, economic growth, wage growth, etc.
The most important thing to remember about the markets is they are constantly surprising — both to the upside and the downside.
Further Reading:
Is Housing a Bubble Waiting to Pop?

