There’s an old saying that they don’t ring a bell for you at the top.
I know this to be true because investors spent more than 10 years during the bull market of the 2010s calling everything they saw a top.
The regime changes are rarely obvious until after the fact.
The same is true when trying to call a bottom during a bear market.
They don’t announce these things over a PA for everyone to hear.
YOUR ATTENTION PLEASE. THE COAST IS CLEAR. THE STOCK MARKET HAS BOTTOMED. IT’S SAFE TO INVEST AGAIN.
Life would be easier if this was the case. But if everything was obvious in the stock market it wouldn’t offer such wonderful long-term returns.
I went down a stock market rabbit hole on YouTube this week and somehow stumbled on this clip of news stories from March 9, 2009:
March 9, 2009 just happens to be the bottom of one of the worst market crashes in stock market history. The S&P 500 fell nearly 60% over an 18-month period.
It certainly wasn’t obvious at the time that day was THE bottom.
Unfortunately, it never is.
The 2008 crash was my first real financial crisis while working in the finance industry. It was a scary time.
Even at the depths of the crisis it felt like things were only going to get worse.
Even with the current bear market that has seen the S&P 500 fall by 25%, the stock market is up nearly 600% or more than 15% per year since that day:
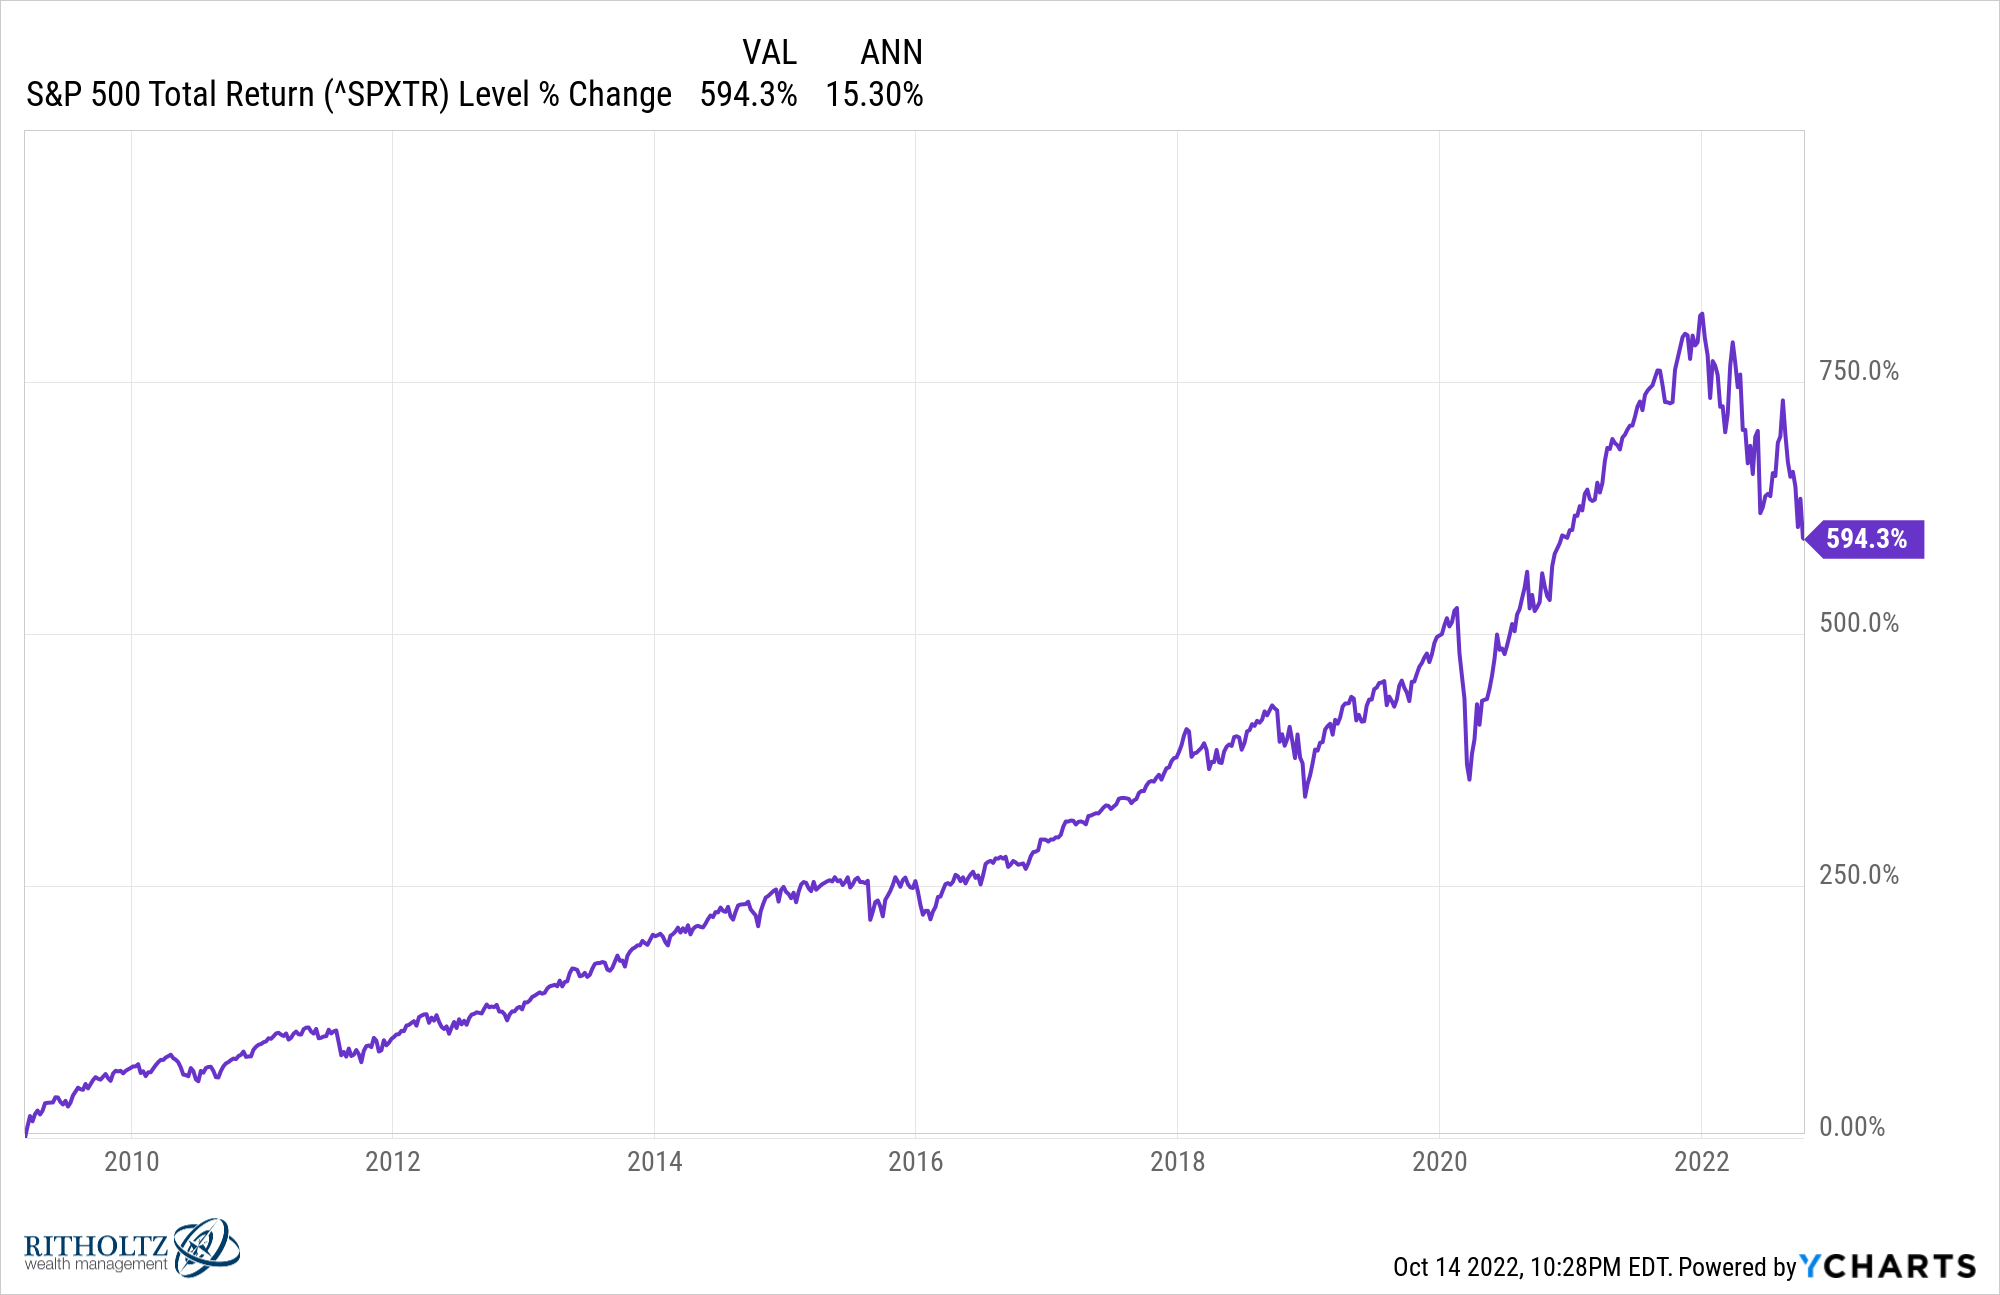
Pretty good.
I don’t share these fantastic returns to show how easy it is to invest from the depths of a bear market.
On the contrary, this is an important reminder of how difficult it is to nail the bottom during a freefall in stocks.
I wish it was easy but there are no all-clear signals to tell you when the dust is going to settle. Just look at various fundamental indicators at the bottom of every bear market since 1945:
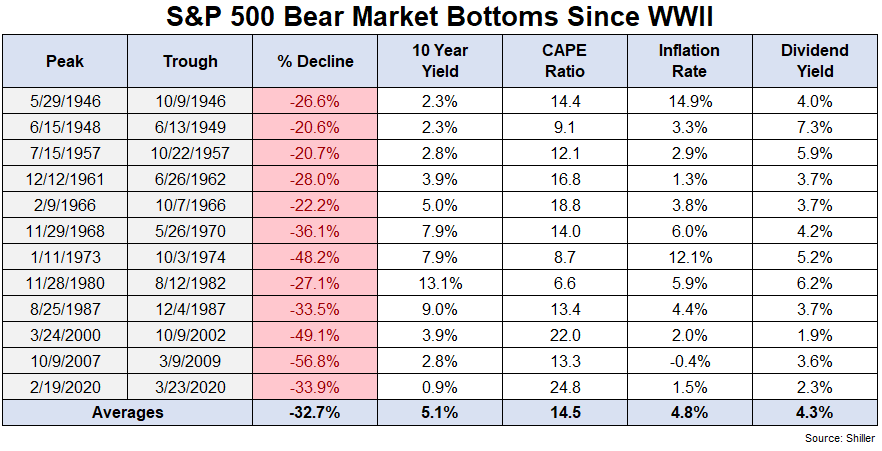
If you look at interest rates, valuations, inflation rates and dividend yields for every one of these bottoms there isn’t much consistency.
Sometimes valuations reach rock bottom levels but not always. Sometimes bond yields are high when stocks bottom and sometimes they’re low.
Dividend yields have spiked during past market crashes but there is no line in the sand. And inflation rates are all over the place so even if you know what price levels will look like 6-12 months from now it still might not help you predict where the stock market will be.
You could try to use the economy as a tell for the stock market but good luck with that.
This is going to sound dumb but the best indicator that lets you know when a bear market is over is price.
The bear market will be over when stock prices start moving higher.
The thing is every time stocks begin going up in times like these, it will feel like a bear market rally or dead cat bounce that’s going to fizzle out.
But one of those bear market rallies that feels like it’s a head fake is going to eventually turn into the net bull market.
There is just no way to tell when this will happen ahead of time.
This is the joy of investing in risk assets.
Sometimes you simply need to have a little faith and a lot of patience.
Further Reading:
How Long Does it Take For Stocks to Bottom in a Bear Market?

