A reader asks:
Ben, you’ve shown time and again that owning the market is a better strategy than picking individual names; however, for people who enjoy the market and want to have some fun on Robinhood, what advice do you have for someone who has found themselves down 25% and 34% in their two biggest holdings and they just keep averaging down, but they can’t ever seem to find the bottom? Historically, do most stocks come back from this kind of decline, or does the data say to cut your losses, even when they’re this painful?
This is something plenty of stock-pickers are dealing with at the moment.
Four out of every 10 stocks in the Nasdaq are currently down 50% or more from their 52-week highs. One out of every 5 stocks in the S&P 500 are down 20% or more from their highs of the last year.
And this is at a time when the S&P 500 itself is less than 2% from all-time highs.
The first problem for many new stock-pickers is things were far too easy coming out of the Corona crash. According to Jason Zweig, from the bottom on March 23, 2020, 96% of all stocks in the U.S. stock market were up over the ensuing year. This was a record high and an outlier.
Most of the time there will be many stocks down even when the market as a whole is up.
Last year the S&P 500 was up almost 30% yet 13% of stocks in the index were down on the year. In 2020, the S&P finished with a gain of more than 18% yet one-third of all stocks were in the red by year-end.
My friends at O’Shaughnessy Asset Management looked at the number of positive and negative returners on the Russell 1000 Index each year going back to 1990:
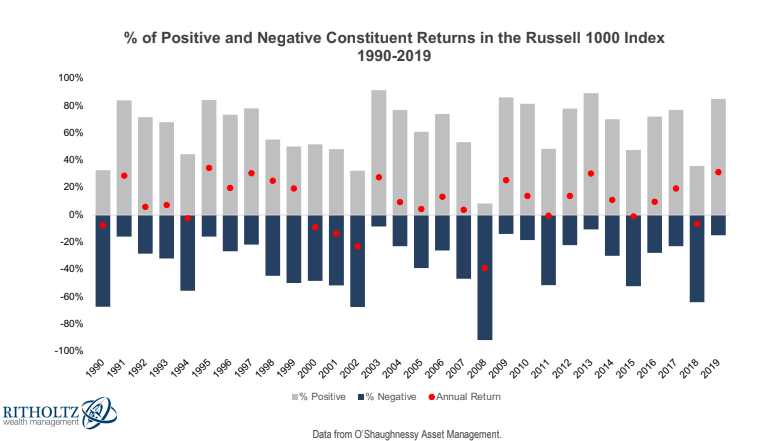
Every year there are bound to be a number of stocks with losses even in a year in which the overall market provides gains.
Even a company like Apple that has seen total returns in the neighborhood of 1200% over the last 10 years has experienced its fair share of drawdowns:
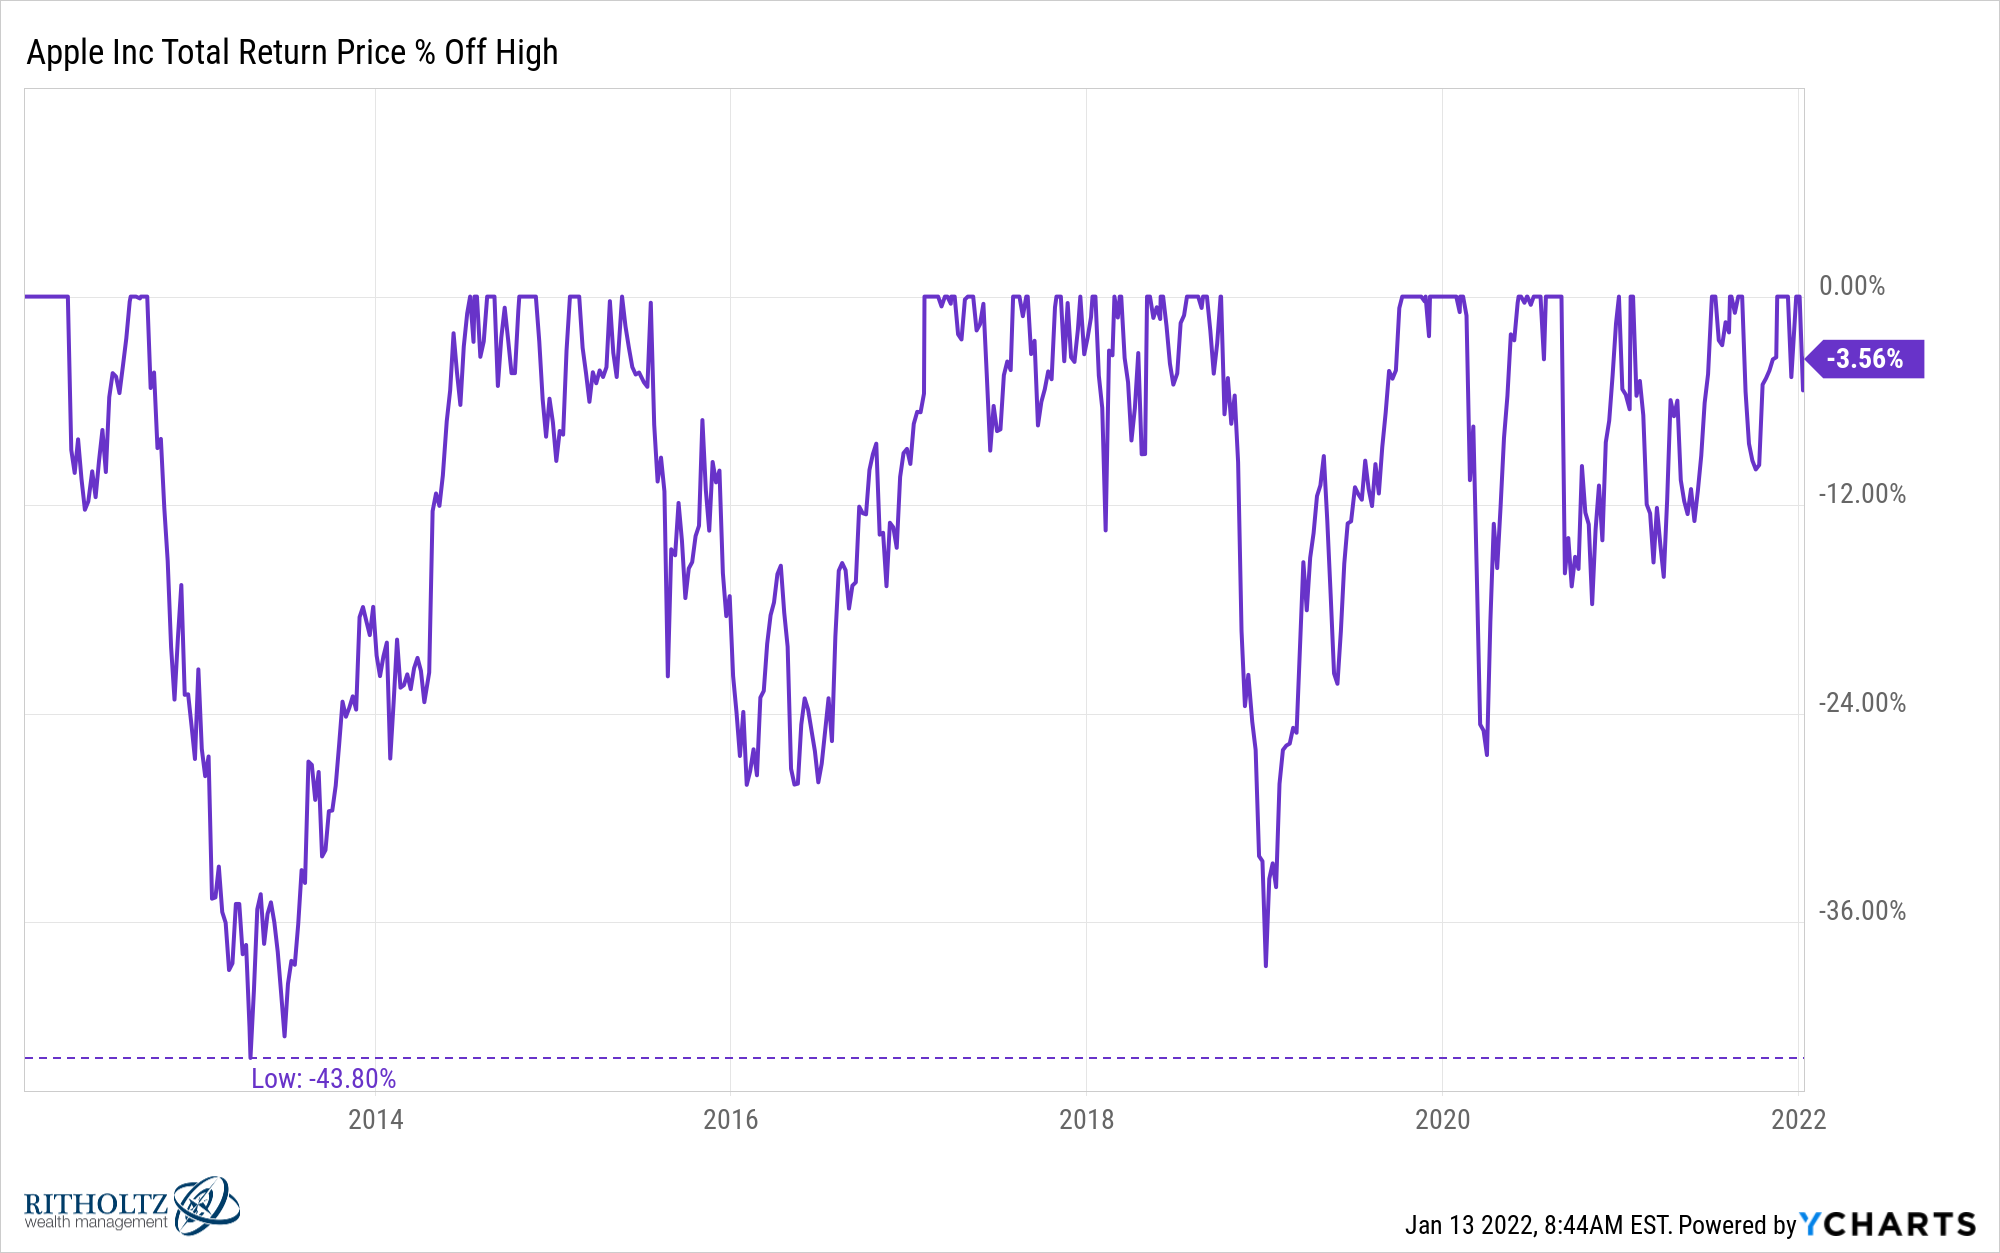
I count 7 different double-digit drawdowns in this time including 4 separate losses of 25% or more (the S&P 500 is down 25% or more just once over the last 10 years).
Even the best stocks get dinged at times. Other examples include losses of 94% and 82% for Amazon and Netflix back in the day, two of the best-performing stocks this century:
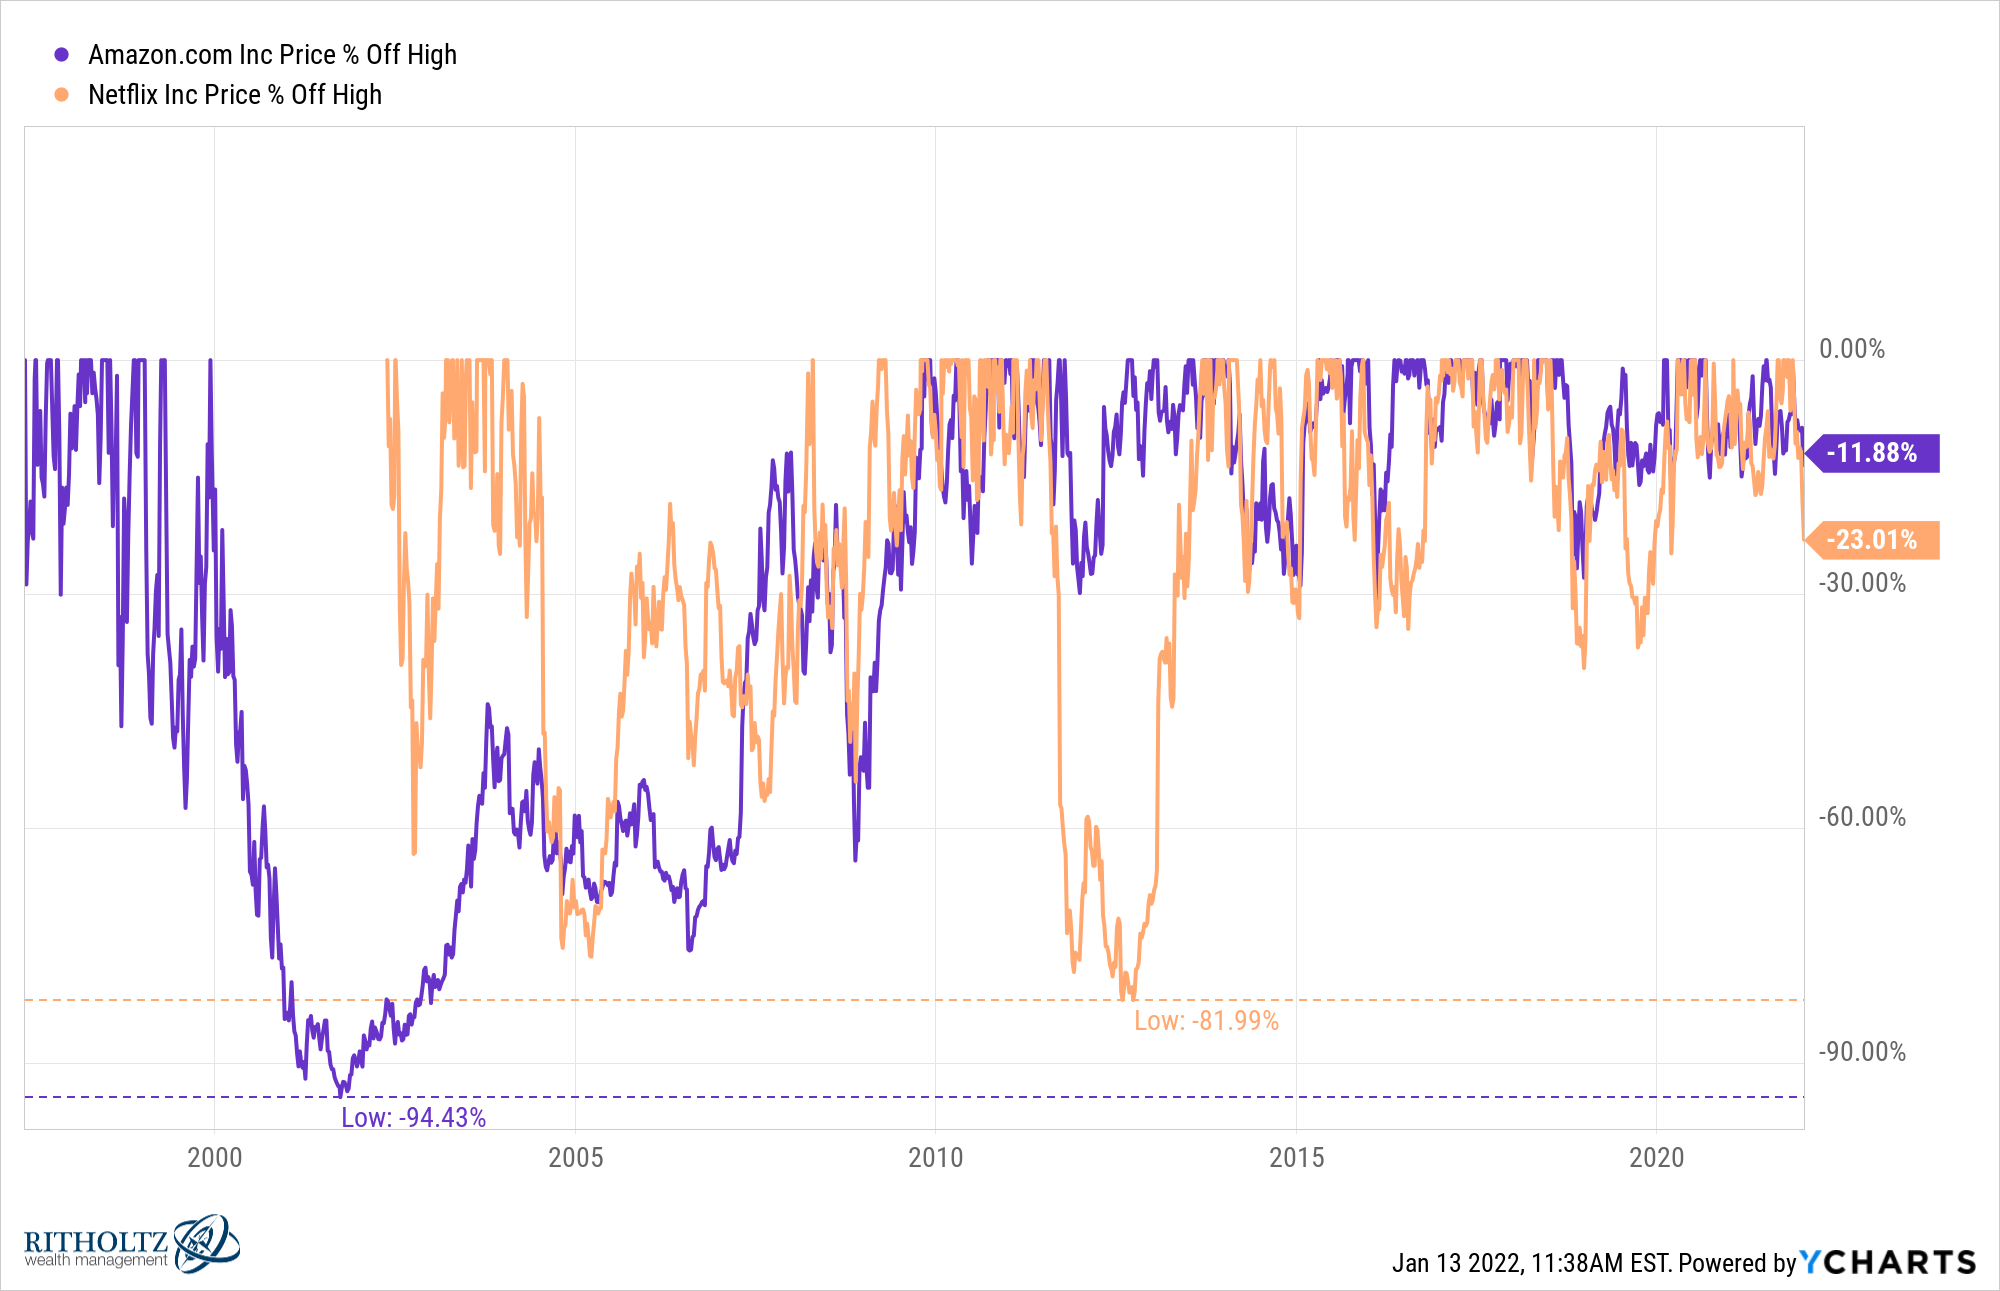
Buying some of the best stocks while they’re in the midst of a massive downturn presents a wonderful opportunity for investors.
On the other hand, there are stocks like Citigroup and AIG that fell 90% and still haven’t recovered:
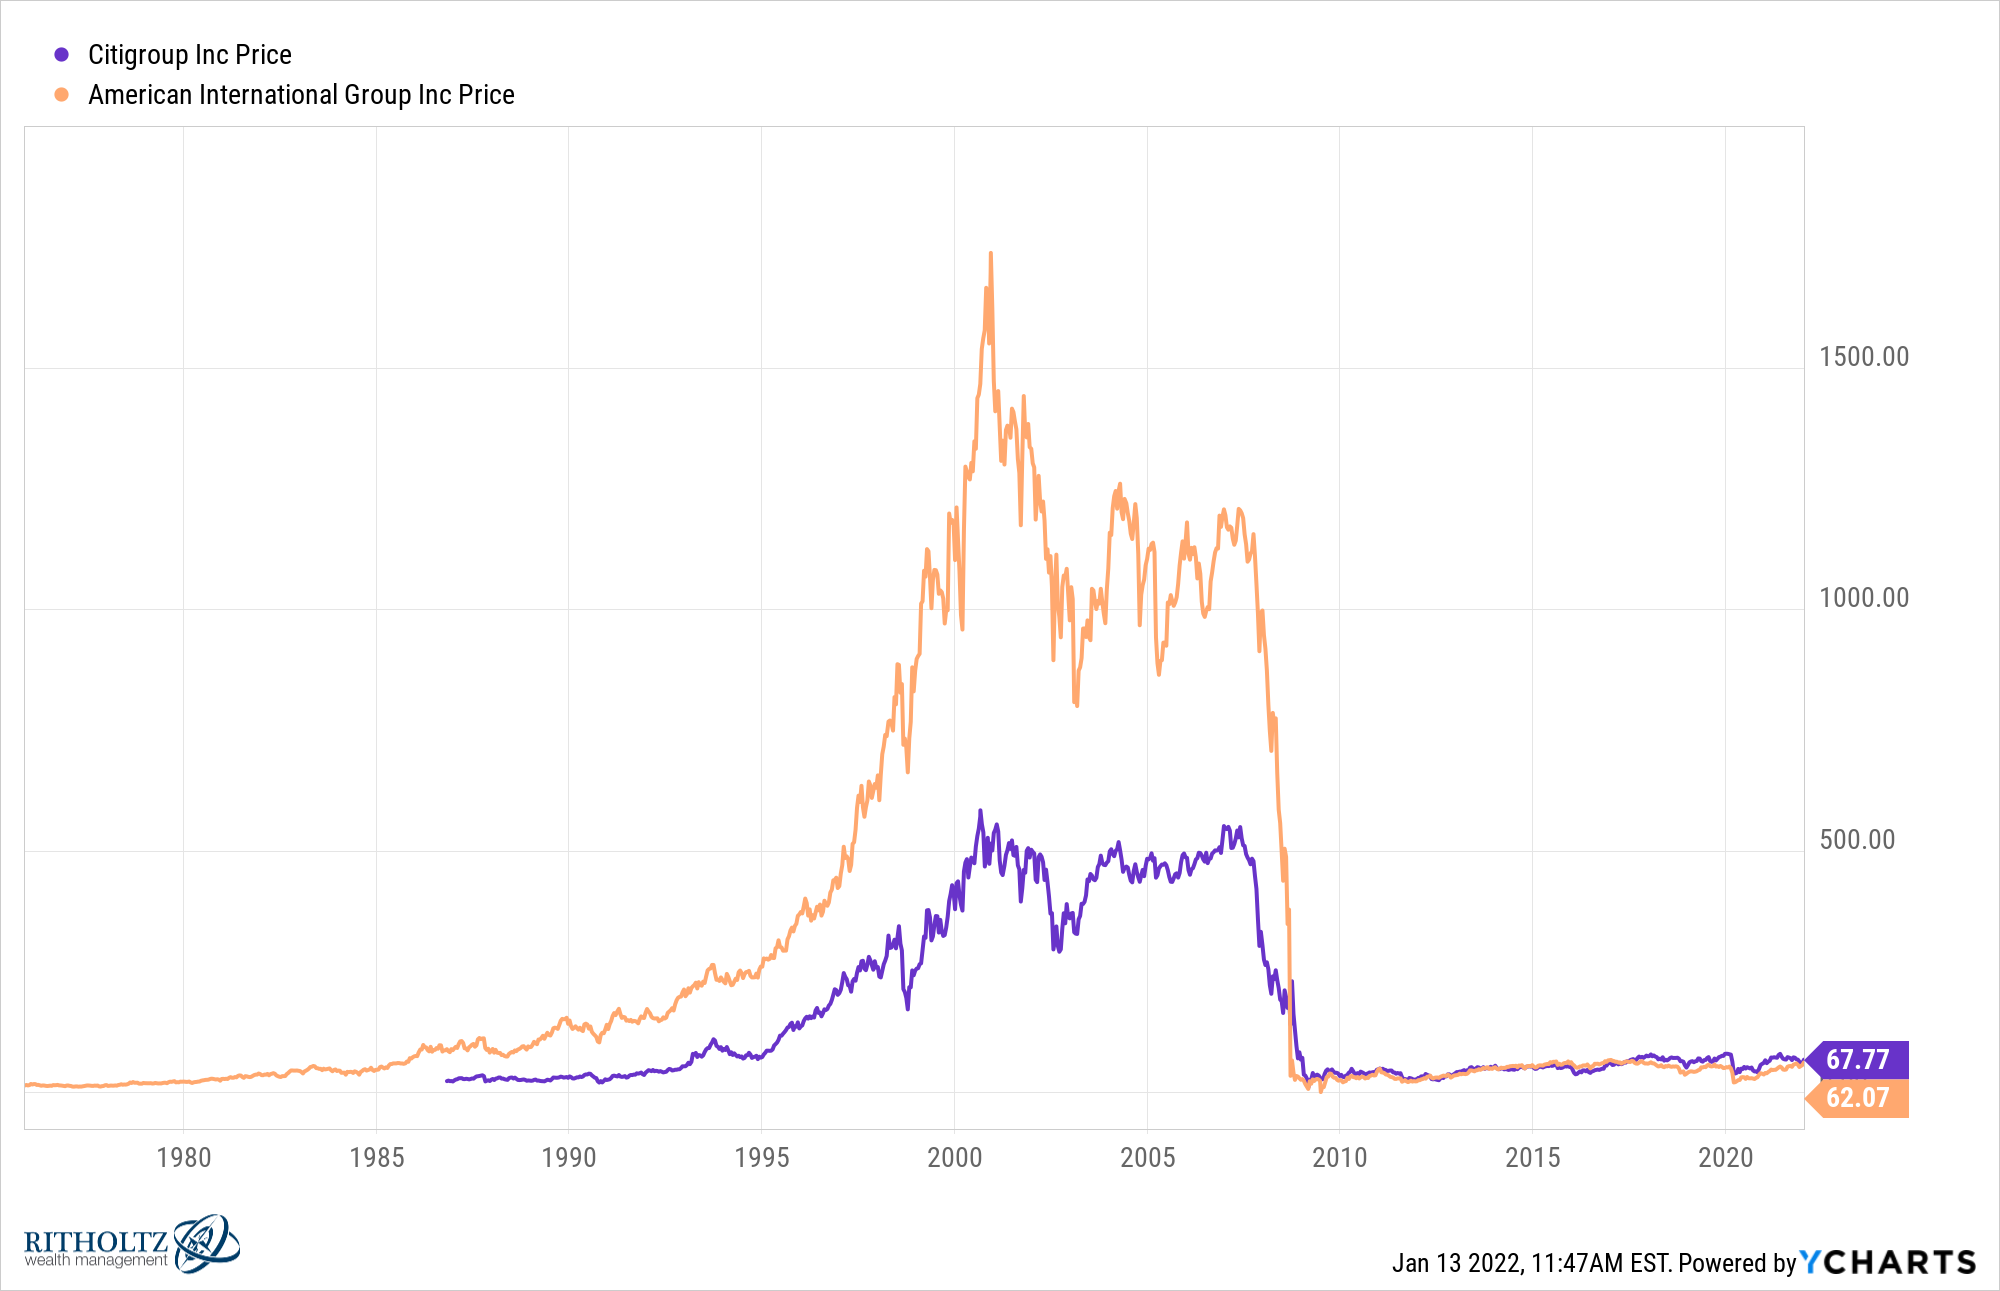
There is, of course, plenty of room between the extreme highs of Apple, Amazon and Netflix versus the crushing lows of AGI and Citi.
One of the reasons owning the market through an index fund or any other diversified ETF or mutual fund is so much easier than owning individual stocks is because you can bank on mean reversion eventually.
No total market index fund is ever going to zero so you can feel more comfortable buying or rebalancing into the pain when the market is down.
The same is not true when it comes to individual stocks so it makes the idea of averaging down much more difficult.
When the market is up and you hold a stock that’s down it can play head games with you. The problem is there aren’t any surefire rules of thumb for when to sell a loser.
There are lots of good books about when to buy a stock. You can use financial statement analysis, quantitative screens or technical analysis.
And if you’re a fundamental stock-picker, a quant or a technical analyst you at least have some rules and numbers you can look at to guide your actions.
Most regular people buy what they know based on the products or services they use. Those who dabble in stock-picking tend to buy brands, trends, stocks that are in the news or stock tips. This makes it much harder to know when you should cut bait and move on.
The hard part is there’s a fine line between discipline and insanity when it comes to investing. Being a disciplined investor would require you to continue averaging down if you still believe in the company. Taking things too far could mean throwing good money after bad.
It’s impossible to know which stocks are going to come back even stronger and which ones are going to stagnate because we can’t predict the future.
Since I can’t answer with certainty whether it makes sense to buy more, hold or sell, here are some questions you can ask yourself as you consider what to do with your stocks that have fallen from loftier levels:
- What’s my threshold for pain in an individual name — 30%? 40% 50%? 60%? If you’re a long-term investor expect to see your individual stocks cut in half at least once.
- Would I be thrilled to buy this stock at lower prices? This question is much easier to answer when a stock is higher than when it’s lower but this can also help you set your risk profile.
- Has the story changed? You can’t answer this if you don’t have a predetermined reason for buying in the first place.
- Do I have better investment opportunities elsewhere? Every investment decision — buy, sell or hold — can be viewed through the lens of opportunity cost.
It’s always much easier to sell a stock when you have a profit. Selling when your stock is down is much harder.
No one wants to look like an idiot for selling the next big winner just because it’s in a drawdown.
We talked about this question on this week’s Portfolio Rescue:
I also had Nick Maggiulli on to help me go over lump sum vs. dollar-cost averaging into the market with bonus money, when to cut back on retirement savings and how to think about using leveraged ETFs in your portfolio.

