A reader asks:
I just started investing in 2020 and this is my first real correction. I know downturns are inevitable but how much longer do you think this can last? Should I change the way I invest now that my portfolio is getting killed?
This is probably a good time for a review because it’s been a while.
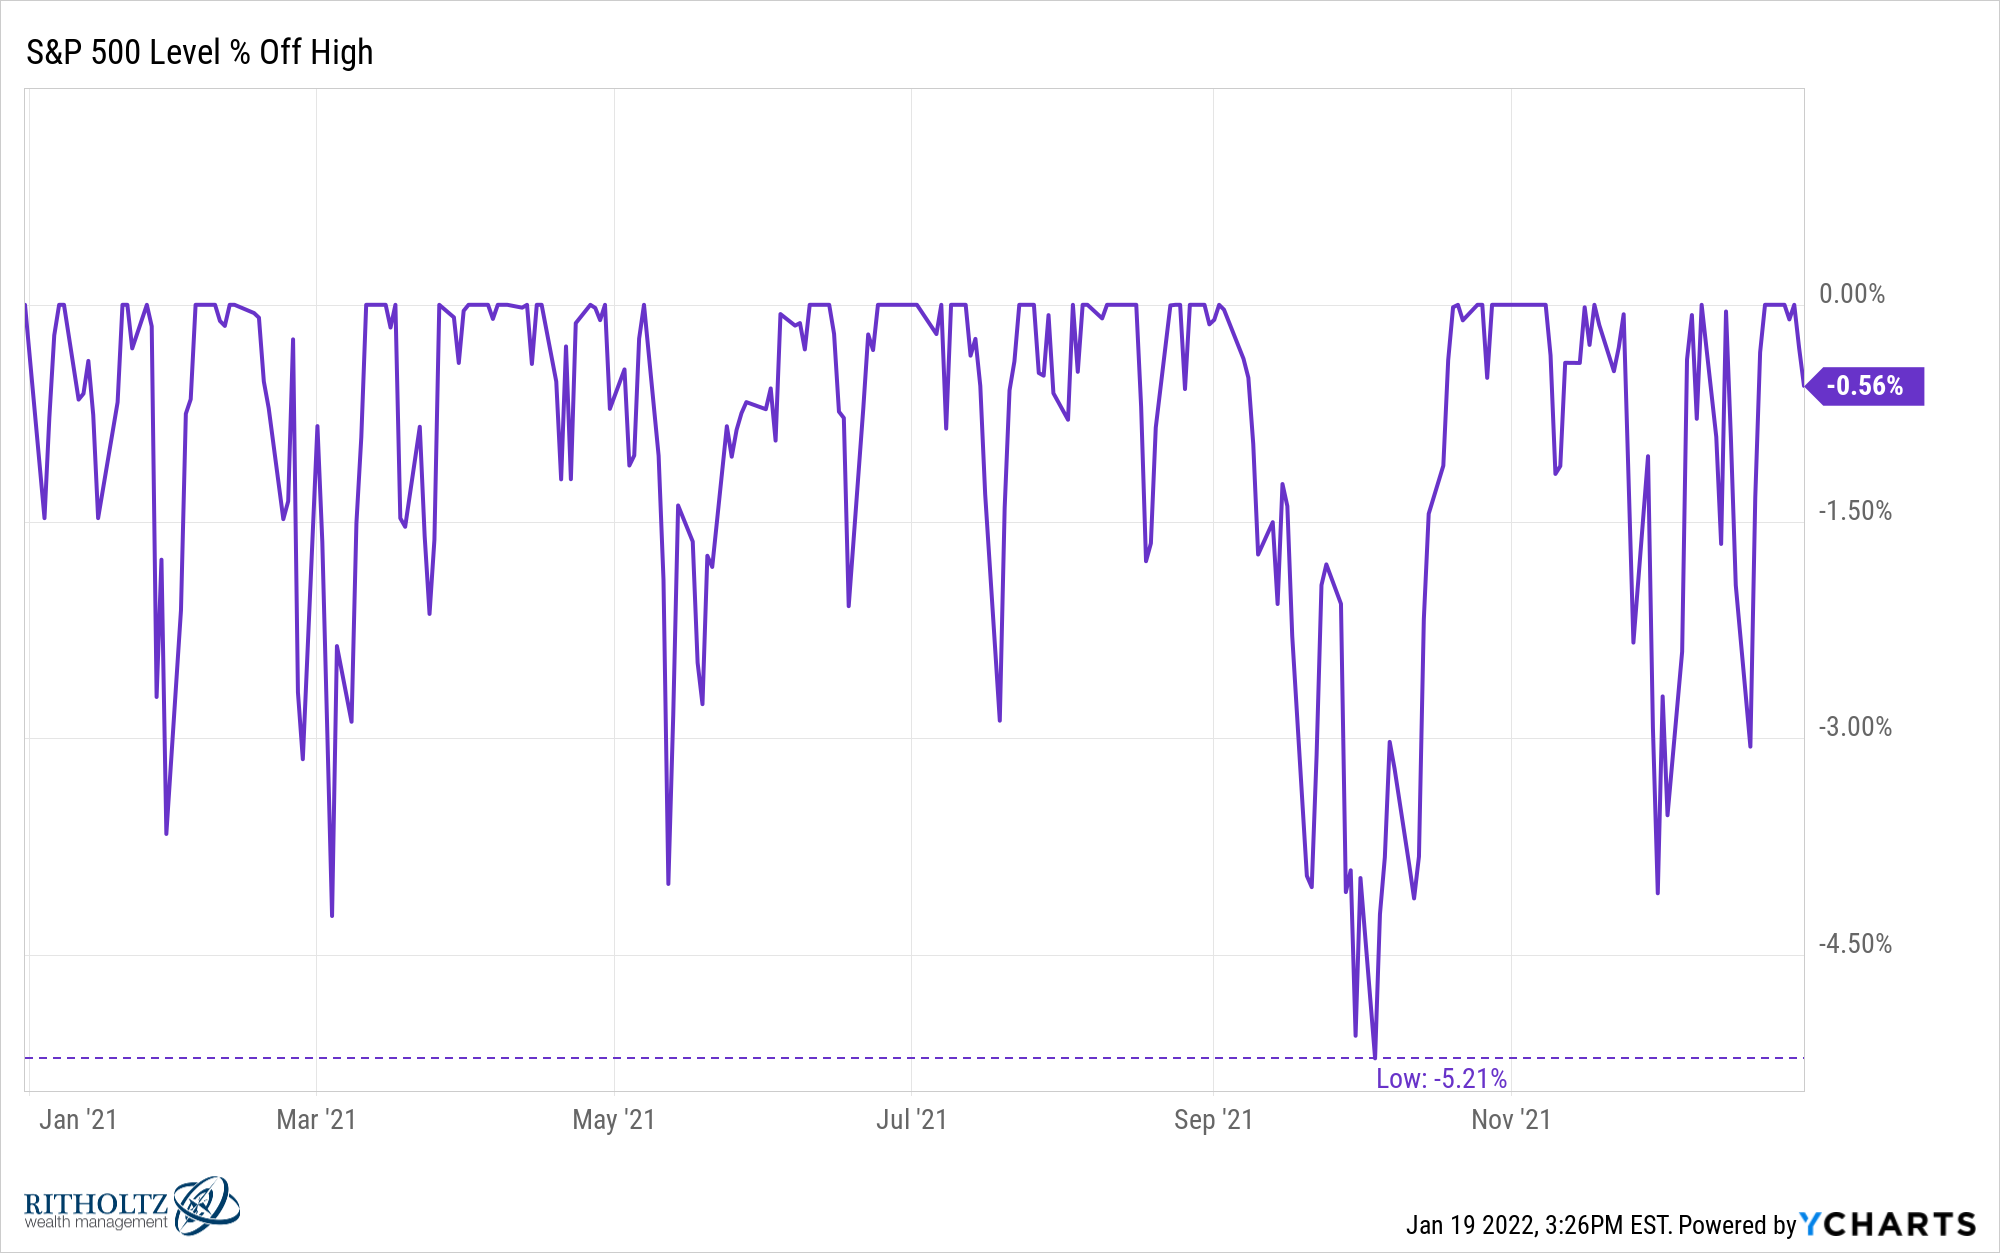
Last year the biggest correction in the S&P 500 was just 5.2%.

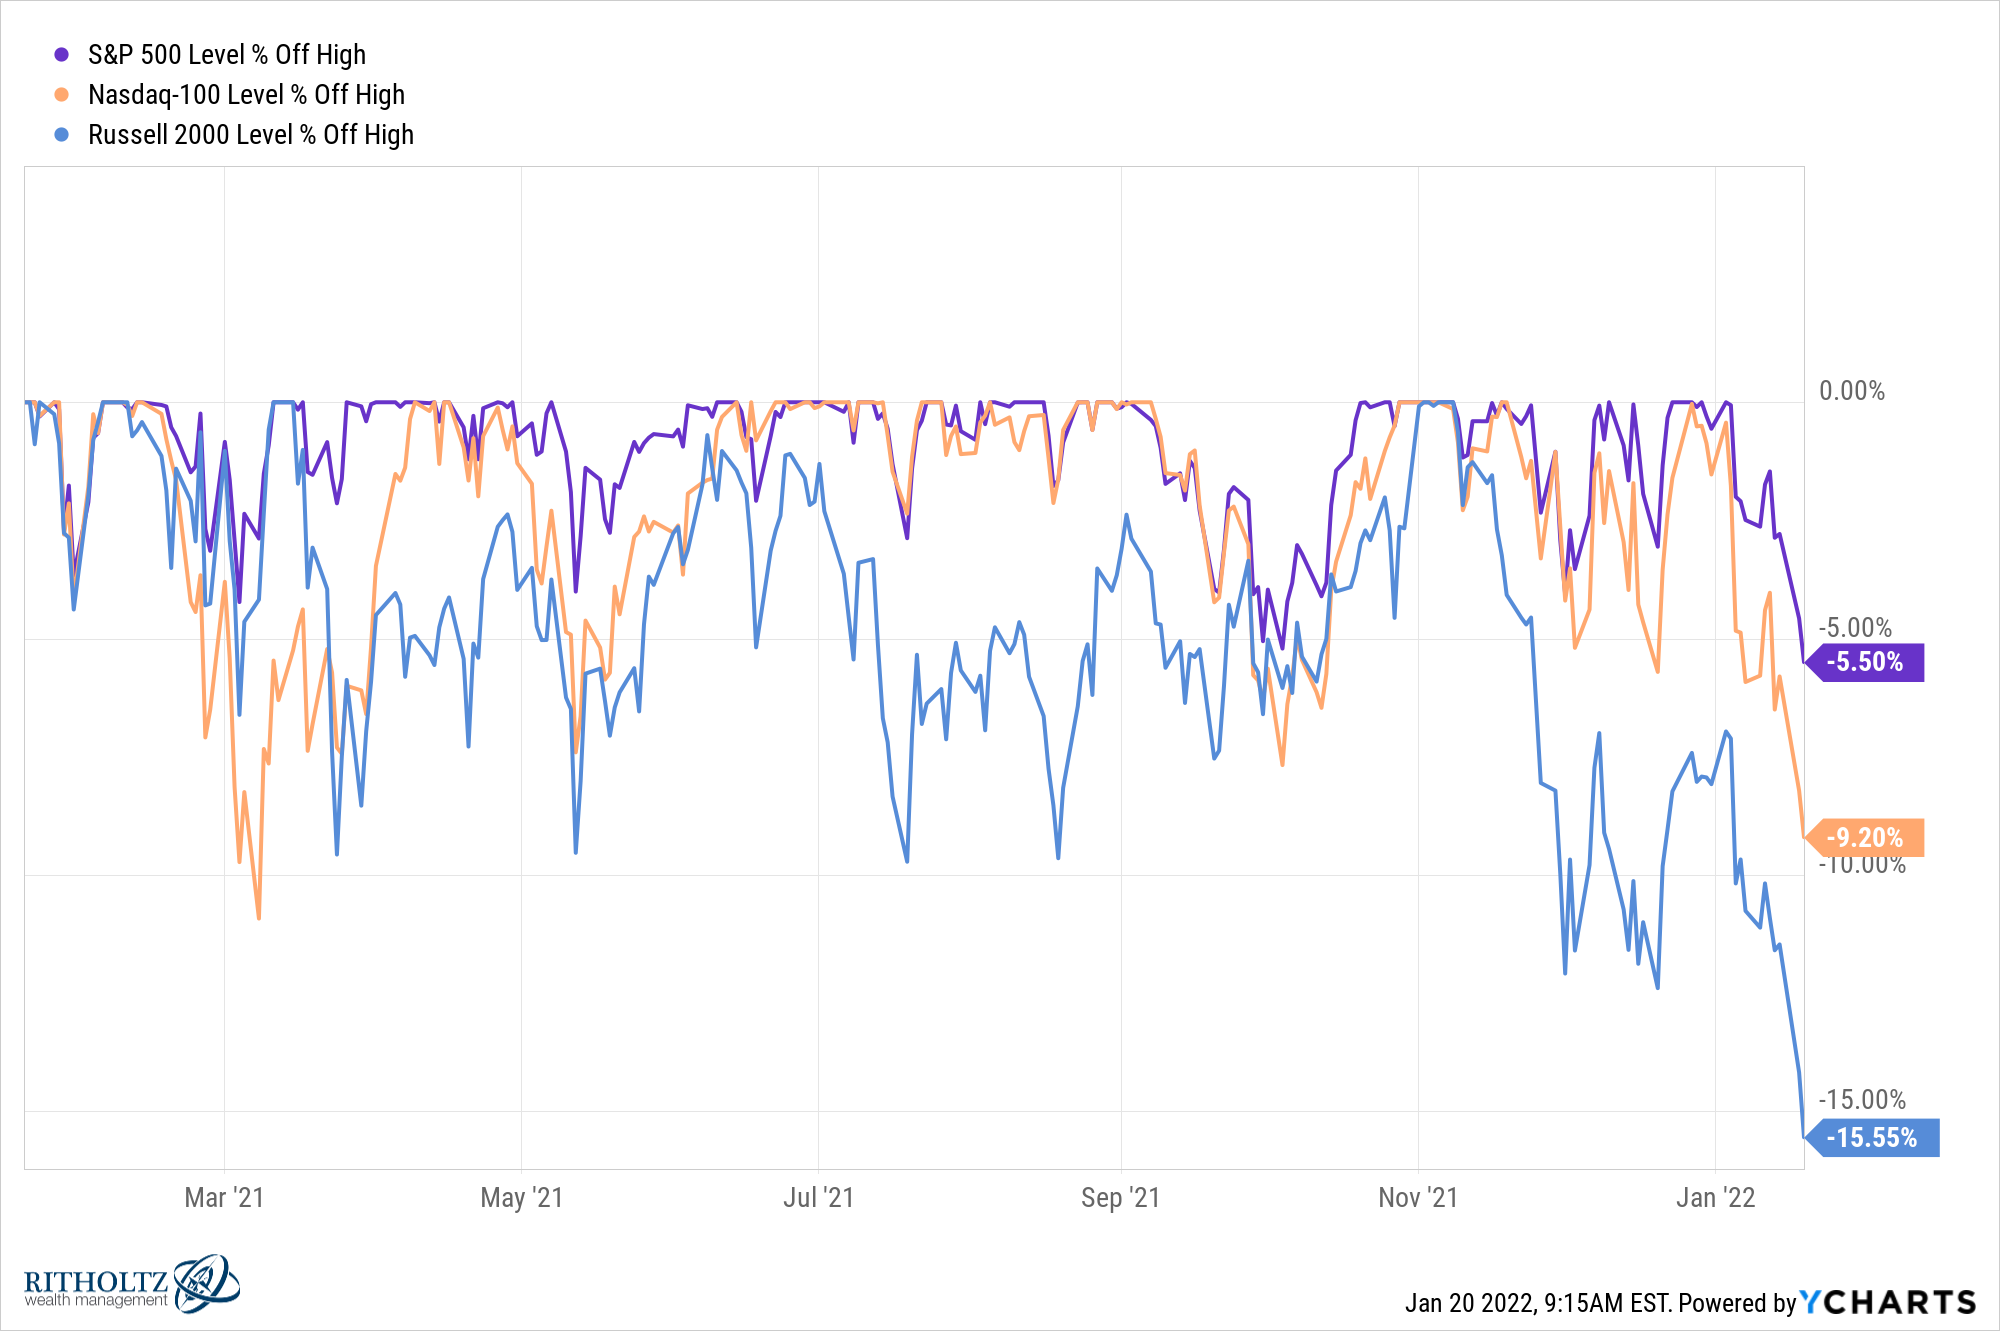
As of Wednesday’s close, the S&P 500 was 5.5% off its highs. That’s still a relatively small loss in the grand scheme of things but we’ve already blown through those small correction levels from 2021.
Other parts of the market are selling off even more. The Nasdaq 100 is down more than 9%. Small cap stocks are down nearly 16%.

It is important to remember this is just something that happens from time to time in the stock market.
The only reason you get high returns over the long run is because you occasionally experience losses in the short run. This is a feature, not a bug.
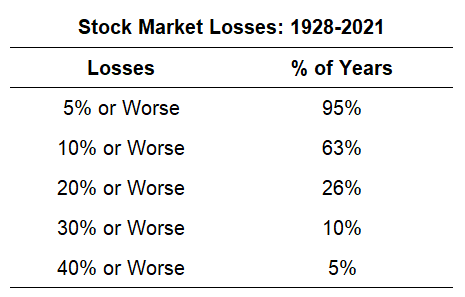
The average drawdown from peak-to-trough in a given year in the U.S. stock market going back to 1928 is -16.3%. And you can see two-thirds of the time there has been a double-digit correction at some point during the year:
These averages are skewed a little higher because of all of the crashes throughout the 1930s, but even in more modern times, stock market losses are a regular occurrence.
Since 1950, the S&P 500 has had an average drawdown of 13.6% over the course of a calendar year.
Over this 72 year period, based on my calculations, there have been 36 double-digit corrections, 10 bear markets and 6 crashes.
This means, on average, the S&P 500 has experienced:
- a correction once every 2 years (10%+)
- a bear market once every 7 years (20%+)1
- a crash once every 12 years (30%+)
These things don’t occur on a set schedule but you get the idea.
The S&P 500 is probably the least volatile of all benchmarks so it can also help to look at other areas of the stock market.
The more tech-heavy Nasdaq Composite Index goes back to 1970. Since 1970 I count 25 corrections2, 12 bear markets and 7 outright crashes.
This means, on average, the Nasdaq has experienced:
- a correction once every 2 years (10%+)
- a bear market once every 4 years (20%+)
- a crash once every 7 years (30%+)
The Nasdaq has also experienced much deeper crashes than the S&P 500.
For example, during the brutal 1973-1974 bear market when the S&P 500 fell 48%, the Nasdaq tumbled 60%.
And when the S&P got chopped in half by 50% during the 2000-2002 crash, the Nasdaq was down a bone-crushing 78%.
Small cap stocks are also far more volatile than large cap stocks.
The Russell 2000 Index of smaller companies goes back to 1979. In that time there have been 22 corrections, 12 bear markets and 7 crashes.
This means, on average, the Russell 2000 has experienced:
- a correction once every 2 years (10%+)
- a bear market once every 4 years (20%+)
- a crash once every 6 years (30%+)
And while the S&P 500 has just one bear market with losses in excess of 20% or more (in 2020) since 2009, the Russell 2000 has seen four bear markets:
- 2011: -29.6%
- 2016: -26.4%
- 2018: -27.4%
- 2020: -41.6%
There are a couple of different ways to look at the increased volatility of these other areas of the market.
On the one hand, more volatility can take a psychological toll on investors and increase the possibility of making a mistake.
On the other hand, more volatility means more opportunities to buy or rebalance at lower prices.
If you’re saving money on a regular basis these corrections are a good thing. It means you’re buying stocks on sale. Young investors should prefer down markets when they are in accumulation mode.
As far as how long this correction lasts, the truth is we don’t know.
Bear markets and crashes are rare. If history is any guide, there is a higher probability this is simply a regular correction as opposed to the end of the world.
But a bear market is always possible when humans are involved in the equation.
I suppose there are some investors who can change up their strategy from bull markets to bear markets but I haven’t met too many who can do so consistently.
I’m a much bigger fan of creating a portfolio that takes corrections and bear markets into account when you create your investment plan. You should strive to create a saving and investing process that is durable enough to handle both up and down markets.
We discussed this question on this week’s Portfolio Rescue:
With the help of my pal Tony Isola, we also answered questions about how much diversification is enough, planning for financial aid when sending your kids to college and which accounts to open for your kids when you want to start saving.
1A bear market is technically defined as a loss of 20% or more. It’s kind of crazy how there have been 5 separate instances where the S&P fell 19% and change but never actually closed down 20%. Horseshoes and hand grenades I suppose.
2It’s possible my correction numbers could be a little short here. It’s difficult to separate out a correction from a crash when you have a period like the dot-com implosion that saw the Nasdaq fall almost 80%. These things are subjective in some ways.
