The S&P 500 is now up more than 20% in 2021.
That’s not much better than the 18.4% gain in 2020 but those gains have been much easier to come by this year.
For example, the worst peak-to-trough drawdown in 2021 is a little over 4%:
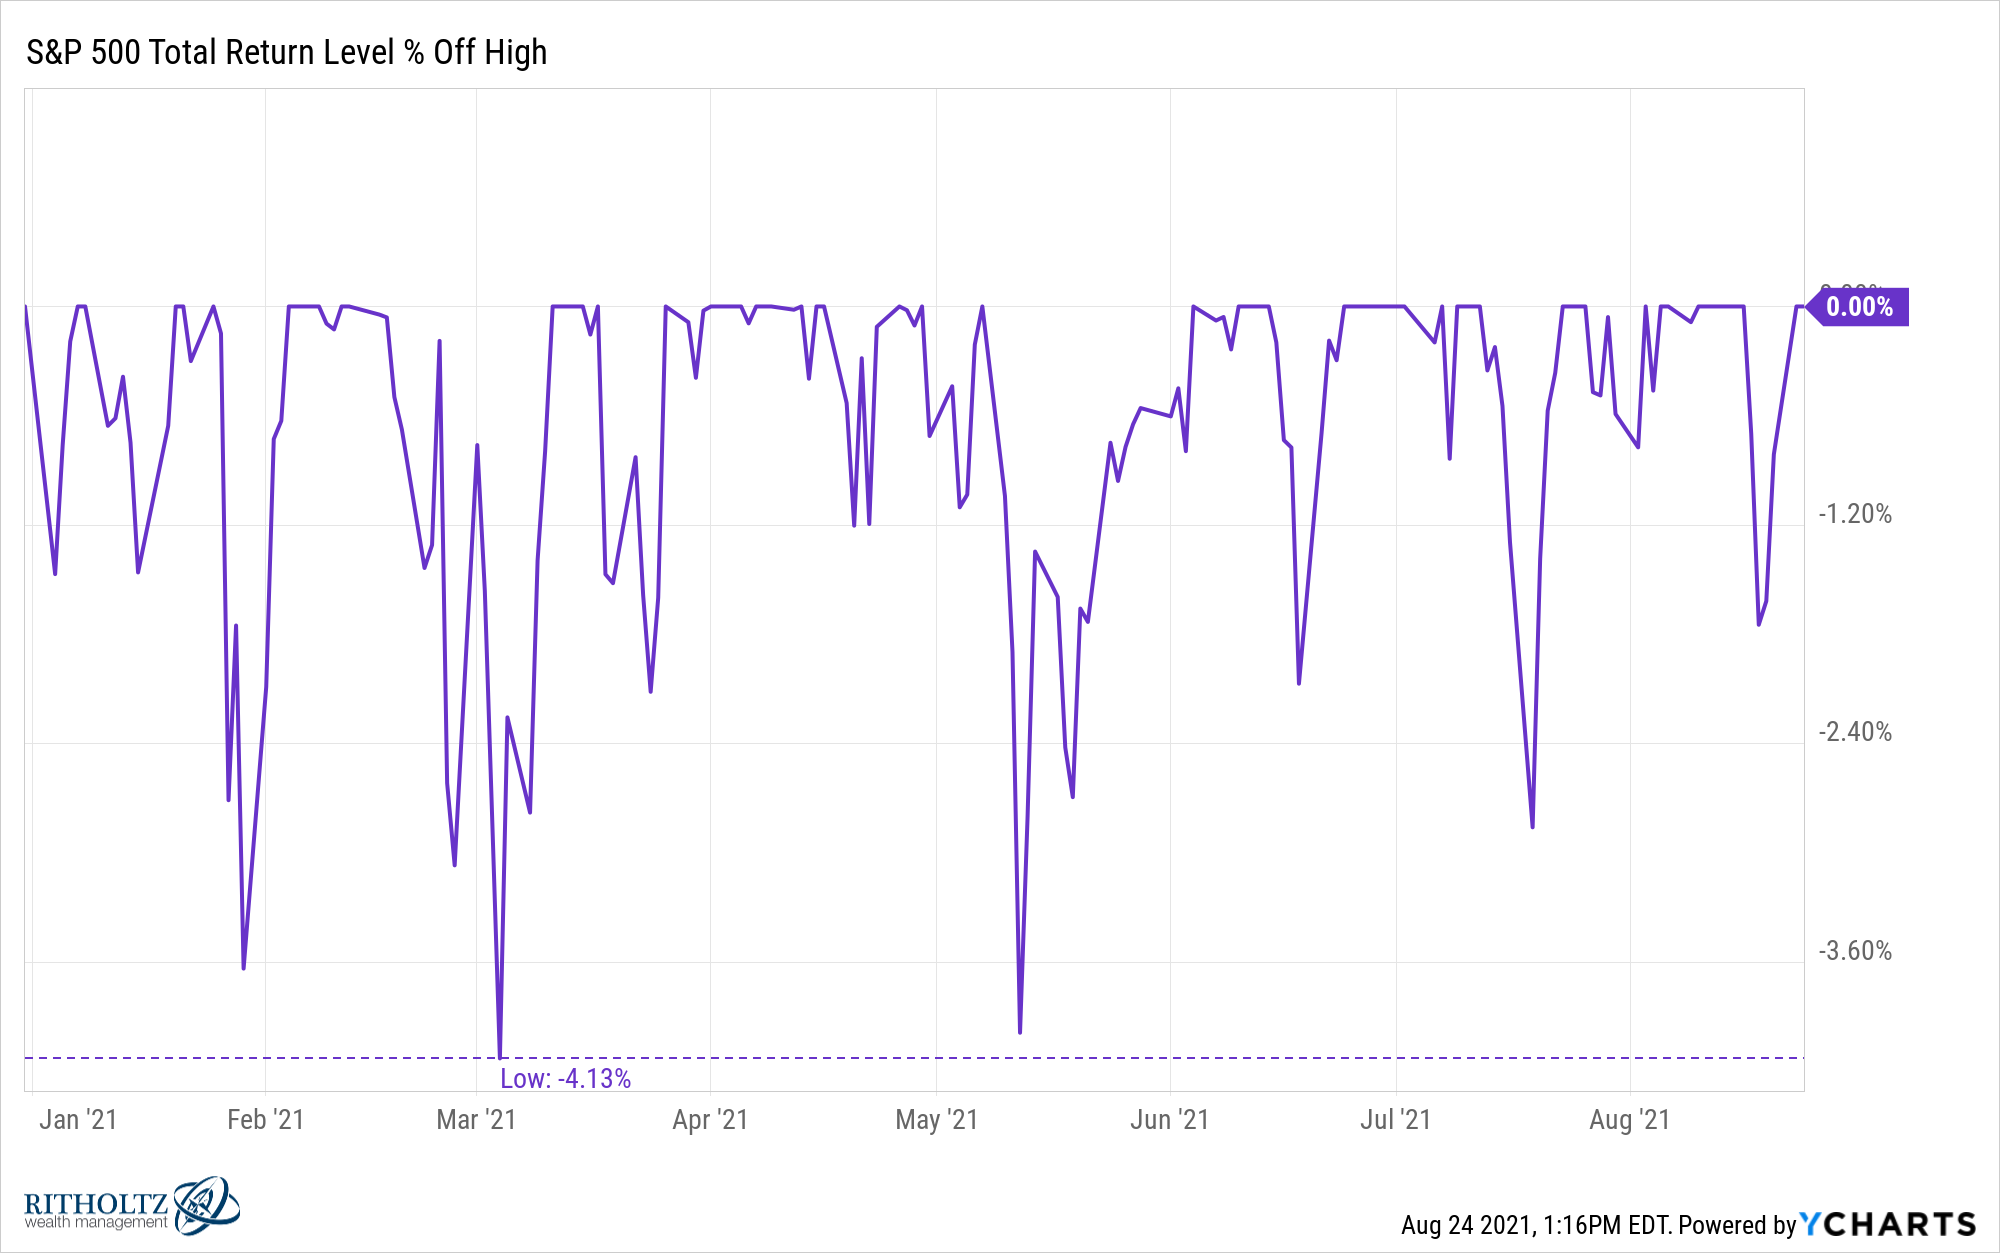
The average intra-year max drawdown in the U.S. stock market is closer to 14% and of course last year the S&P was down 34% in a matter of weeks.
Volatility is basically non-existent this year. Not only have there now been 50 new all-time highs through the close on Monday, but just 3 days in which the S&P 500 was down by 2% or worse. In contrast, last year saw 25 down days of 2% or worse. That includes the 16 days with losses of 3% or worse. The worst daily loss in 2021 is just 2.6%.
And it’s not just the behemoth tech stocks propping up the market this year. Yes, some of the quatro-comma market cap tech stocks are doing well this year:
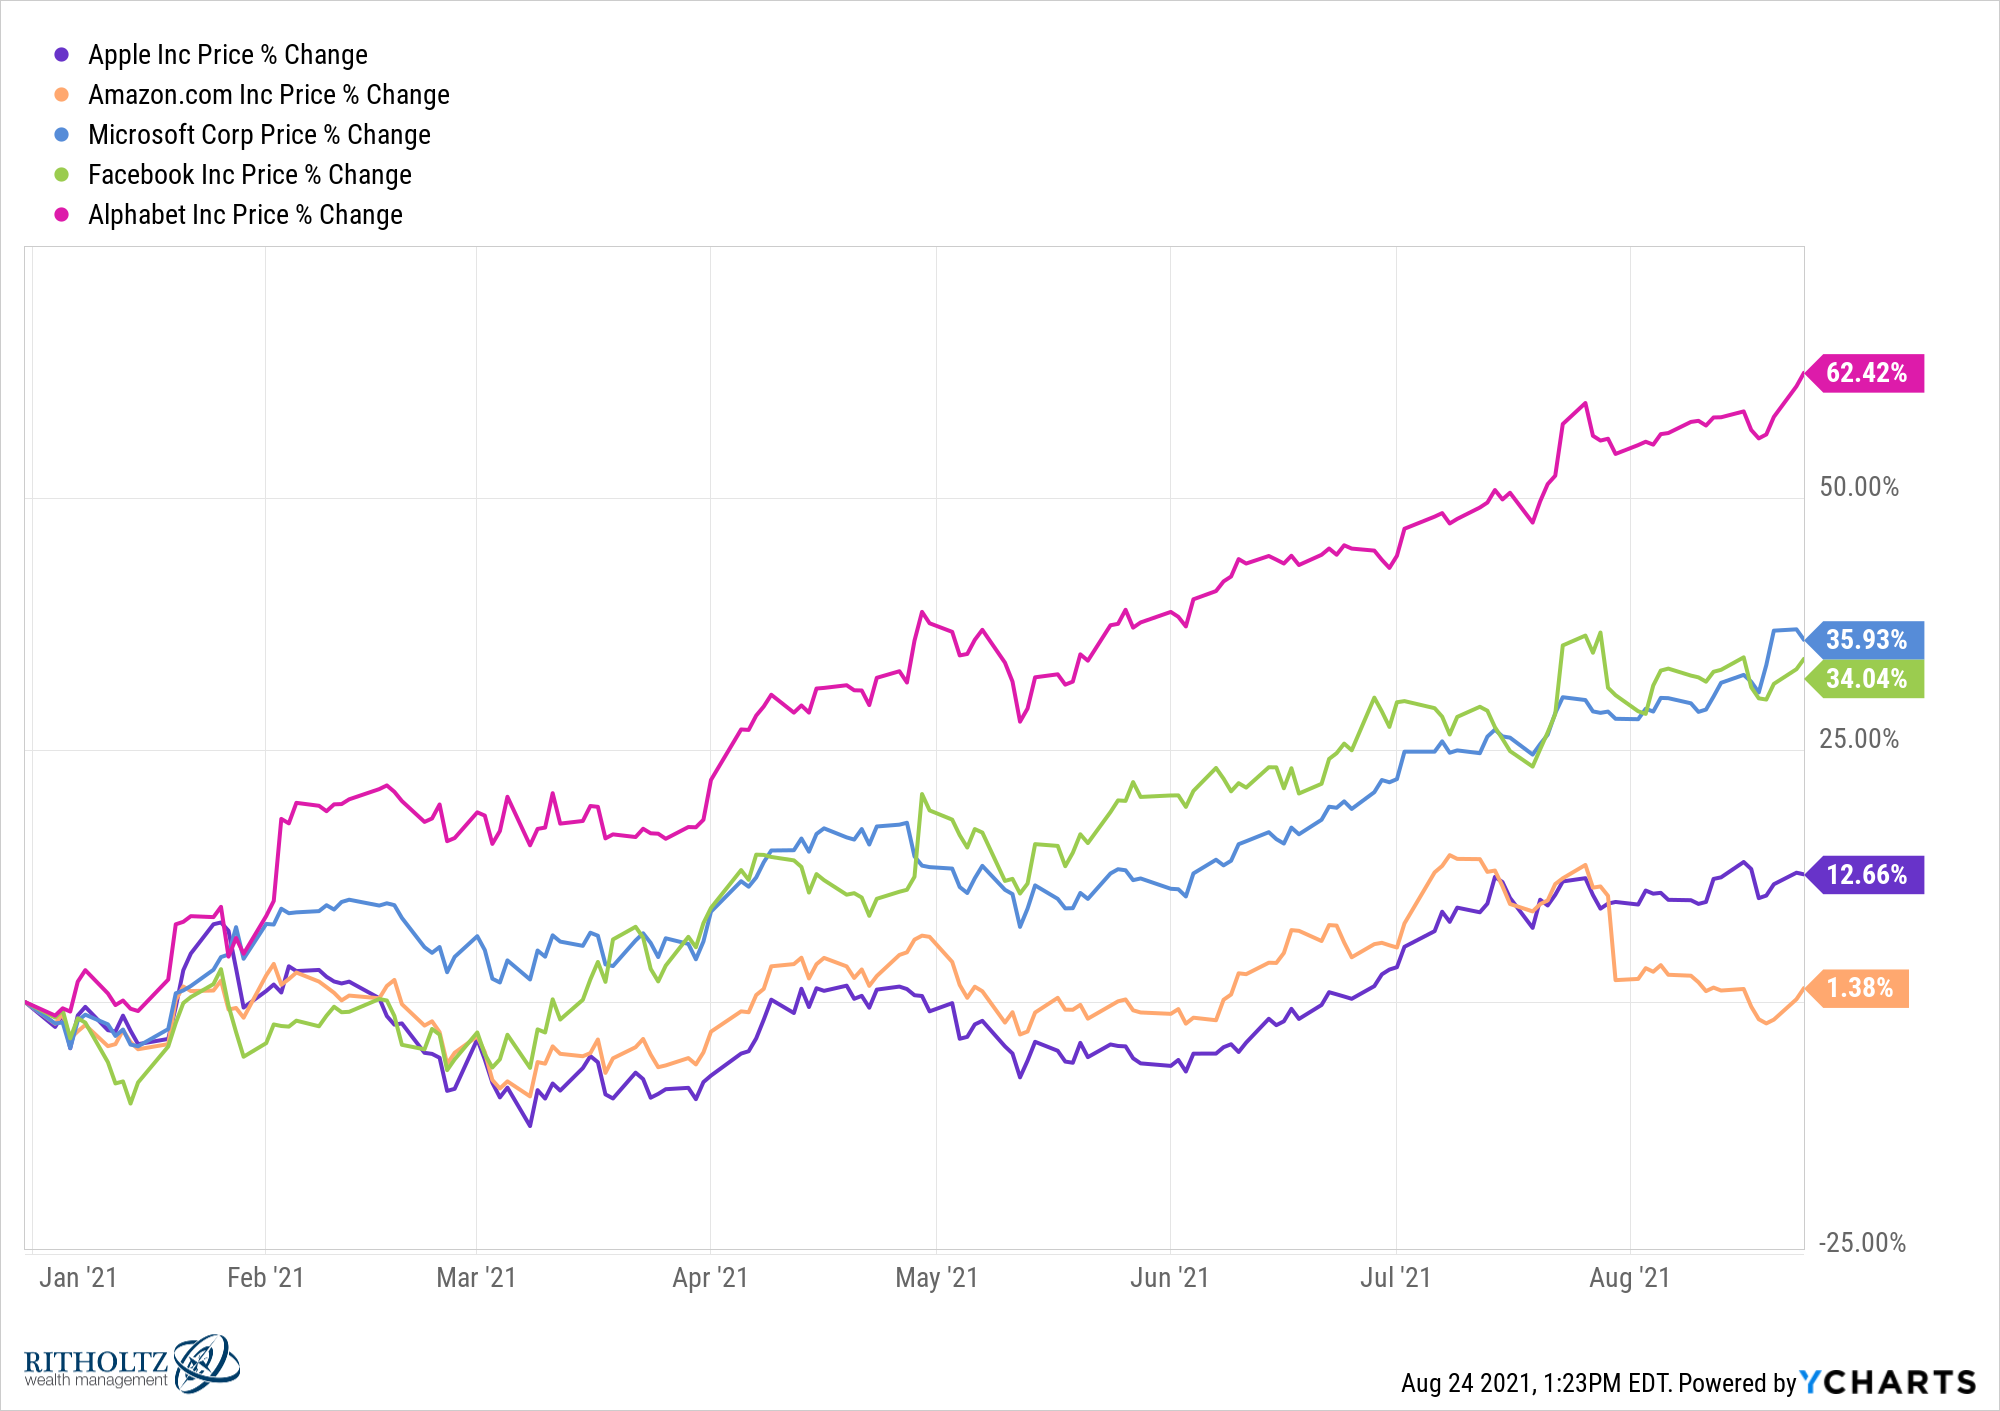
But so is the majority of the S&P 500.
Through last Friday, nearly 50% of the 505 stocks in the S&P 500 have gains of 20% or higher this year. And 70% of S&P 500 corporations are up at least 10% on the year.
(It’s fitting that the best performer in the entire market this year, by a long shot, is vaccine-producer Moderna. It’s up almost 300%. The next best-performing stock is up around 120%.)
Typically, there is at least one sector that gets shellacked, even when the rest of the market is on fire. For instance, last year the energy sector was down more than 30% in a year in which the S&P 500 was up 18%.
This year, every sector in the S&P is holding up just fine:
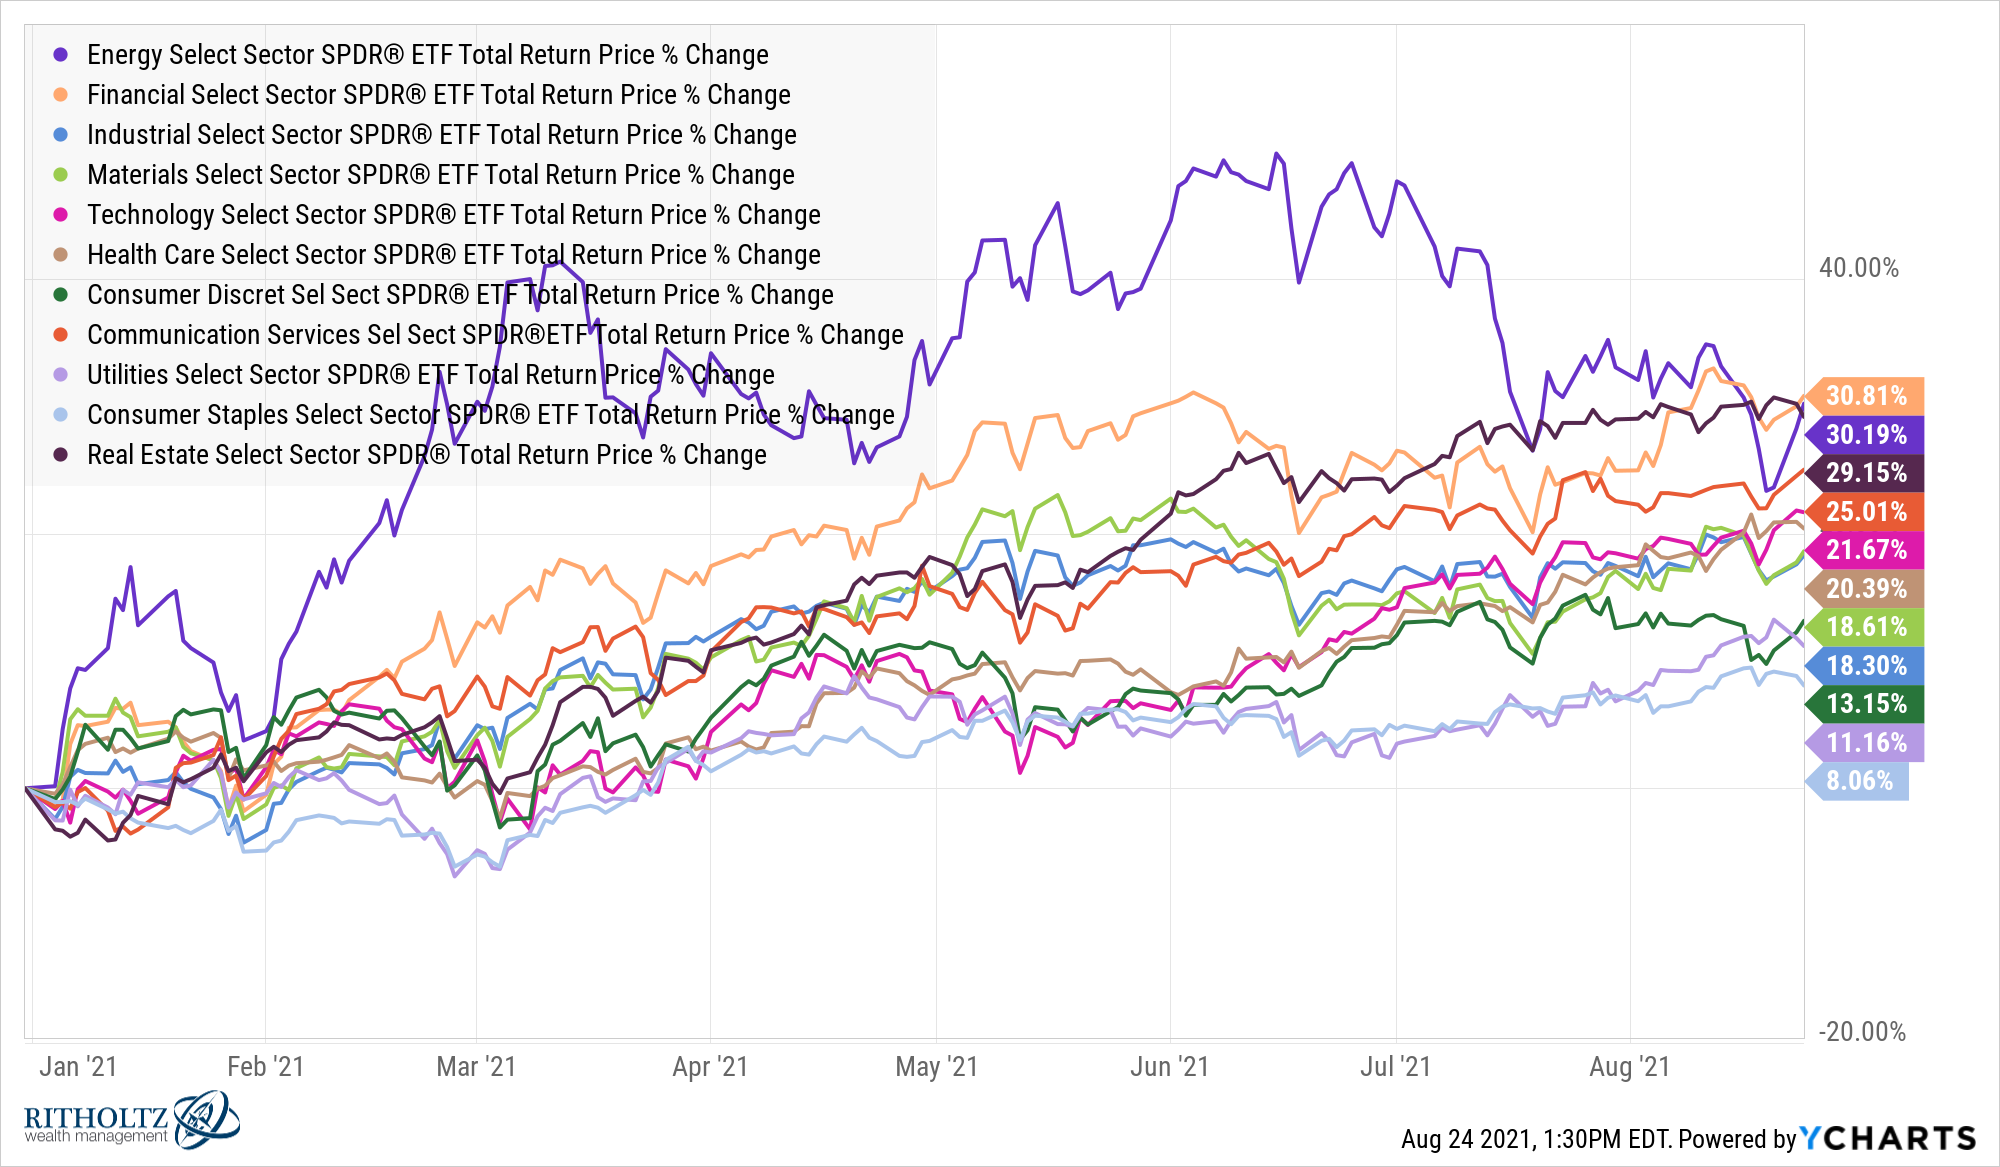
Consumers staples are the worst performer of the group with an 8% gain. That’s not bad.
It is worth noting the two top-performing sectors, financials and energy, were two of the worst-performing sectors in 2020 (financials were down 2% or so).
By all accounts, this seems like it should be about as good as it gets when it comes to the stock market. The overall market is up. Every sector is up. The majority of stocks are up.
It’s not always going to be this easy but it is worth noting gains of 20% or more happen more frequently than you may think.1
The U.S. stock market is up 20% or more in 34 out of the past 95 years (36% of the time). In that same time, it’s experienced a loss in 25 out of 95 years (26% of the time).
So historically, you would have been more likely to experience a 20% gain in a given year than a loss in the U.S. stock market.
That’s a pretty good track record.
It’s also impressive this is happening at a time when the S&P 500 is up 12 out of the past 13 years (including this year).
Should we be pleasantly surprised by this year’s performance? Concerned? Unaffected?
Josh and I discussed this and more on What Are Your Thoughts?:
Further Reading:
Stock Market Returns Are Anything But Average
1I realize this year is not done yet and we could still experience a nasty correction before the year is done. My point still stands.
