
After sitting through an exceedingly long parade over the Fourth of July weekend I have a new rule proposal:
No parade should ever be longer than 30 minutes in length.
I mean how many sirens can one family be subjected to?
I’m only half kidding here because my kids loved it but it still seems like you could cut 60% from most parades and the kids would still be happy (as long as they get some candy).1
Much like parades, bull markets can last longer than you think as well.
Market research has benefitted greatly from the information age. There are a plethora of free websites, data, opinions, analysis, charts, and news that rival even the most expensive subscription services of the past.
One of the free research sources I use on a regular basis is Yardeni Research (they do have paid research too). And one of my favorite research pieces of theirs I look at regularly is the bull and bear market/correction tables.
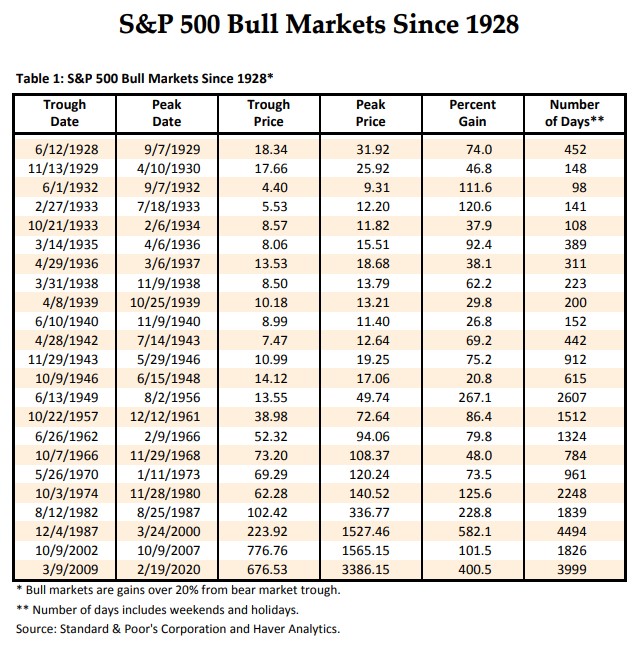
Here’s the table of bull markets from 1928:
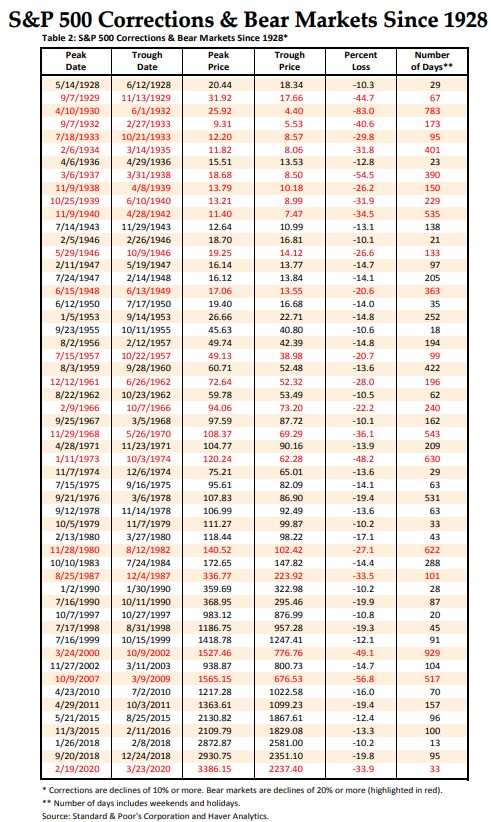
And all of the corrections and bear markets:
The definitions of bull and bear markets are subjective and perhaps semantics on some level but here are some thoughts on these tables:
Corrections and bear markets outnumber bull markets by a factor of more than 2-to-1. By my count, there have been 23 bull markets (24 including the current one) and 53 corrections and bear markets (which includes 32 corrections and 21 bear markets).
Maybe this is one of the reasons losses sting twice as bad as gains feel good — downturns occur more often.
Bull markets can last longer than you think. Bull markets make up for a lack of quantity with magnitude and length.
While the downturns have lasted an average of 207 days peak-to-trough, the upturns have lasted an average of 1,121 days from trough-to-peak.
The average loss is a downturn of 23% while the average gain was 122%. Obviously, the ranges around the averages are wide but the up markets more than make up for the down markets over time.
Dividends matter more than you think. The gains shown on these tables are calculated using the price-only index for the S&P 500, not including dividends.
This matters much more for the bull markets than the bear markets.
For example, the price gain from 1987-2000 was 582%. Yet the total return, including dividends, was closer to 800%.
Yields are much lower now than they were in the past because of the prevalence of buybacks, but every bit helps over the long-term.
Downturns are a natural extension of bull markets. One of the problems with bull markets is you begin to feel invincible.
Things feel pretty good right now. The economy is back on track and humming along nicely. The stock market is hitting new all-time highs on the regular. It’s basically been impossible to lose money over the past 15 months and change.
That will change eventually. I don’t know when and I don’t know why but the stock market will take a breather at some point.
I don’t know if that means a minor correction or a bigger bear market but it will happen. You don’t get the big gains without big losses on occasion.
Based on Yardeni’s table, the U.S. stock market has experienced a double-digit loss once every year-and-a-half or so since 1928.
These things don’t run on a schedule like a train station but it is important to build downturns into your expectations when investing in stocks, even during bull markets.
Bull markets are inevitable because of innovation and the power of the human spirit.
But corrections are also inevitable because human nature causes us to freak out from time-to-time.
Further Reading:
How to Prepare for a Lengthy Bull Market
1Mitch Hedberg had a funny take on this one too: “If you’re watching a parade, don’t follow it. It never changes. If the parade is boring, run in the opposite direction. You will fast-forward the parade.”

