Warren Buffett was none too kind to bonds in his annual shareholder letter this past weekend:
And bonds are not the place to be these days. Can you believe that the income recently available from a 10-year U.S. Treasury bond – the yield was 0.93% at yearend – had fallen 94% from the 15.8% yield available in September 1981? In certain large and important countries, such as Germany and Japan, investors earn a negative return on trillions of dollars of sovereign debt. Fixed-income investors worldwide – whether pension funds, insurance companies or retirees – face a bleak future.
Buffett doesn’t really offer any alternatives, except to warn:
Some insurers, as well as other bond investors, may try to juice the pathetic returns now available by shifting their purchases to obligations backed by shaky borrowers. Risky loans, however, are not the answer to inadequate interest rates. Three decades ago, the once-mighty savings and loan industry destroyed itself, partly by ignoring that maxim.
Even after a slight bump up in rates these past few months, I agree with Buffett that there are no easy answers in the fixed income space. Just look at the various U.S. government bond yields by maturity:
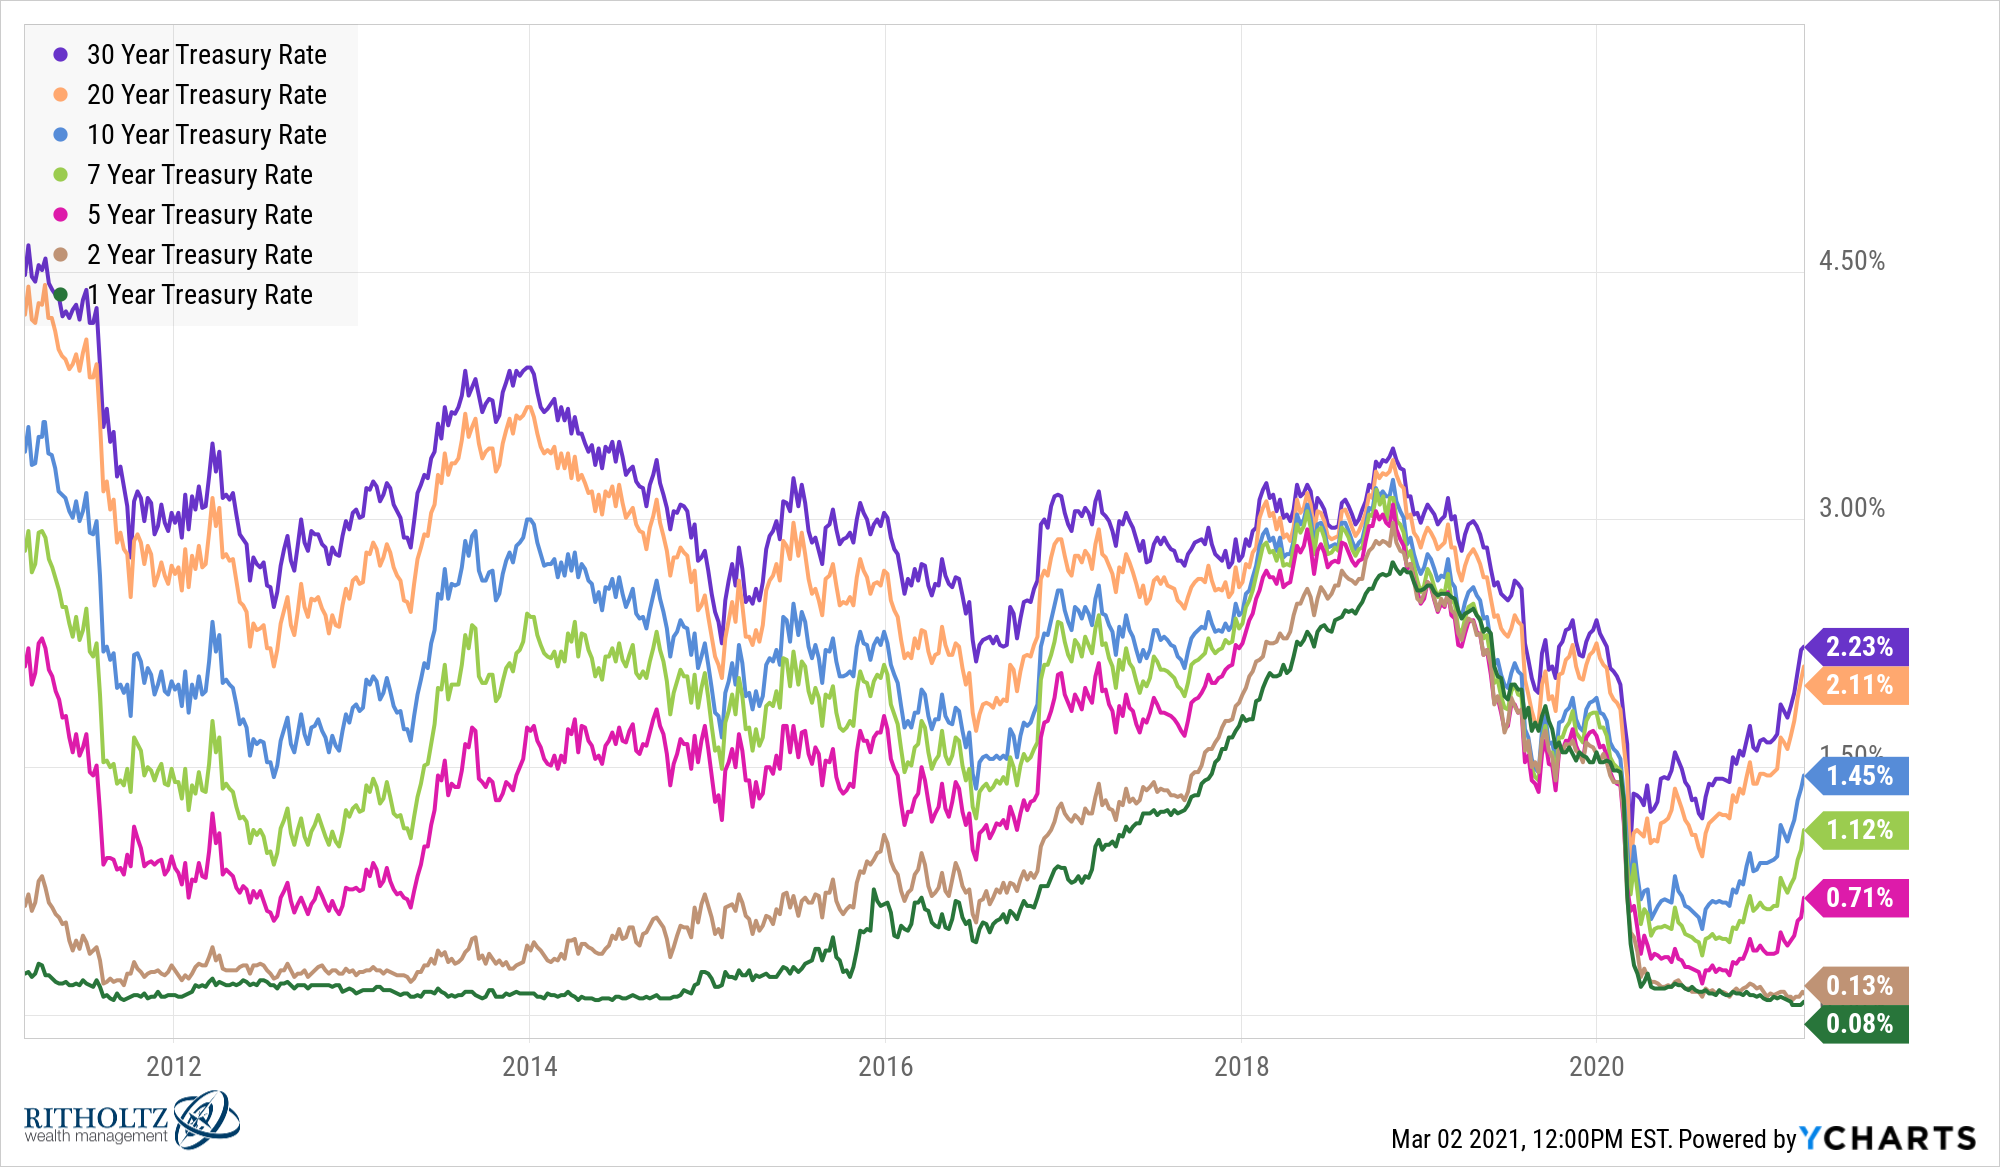
Now that long-term yields are much higher than short-term yields, it might be tempting to go out on the risk curve to pick up some more income.
Every investor has their own appetite for risk but long-term government bonds are a buyer beware situation.
Yes, if rates fall, long-term bonds will perform better than short-term bonds because, all else equal, longer duration fixed income gets you a bigger bang for your buck.
But this works in both directions.
The past 10 years or so have seen a gradual fall in rates, even after the recent upswing. In 2012, the 30 year treasury was yielding more than 4.5%.
Yet in that time, long-term government bonds (TLT) have had the exact same amount of double-digit drawdowns as the S&P 500 (SPY):
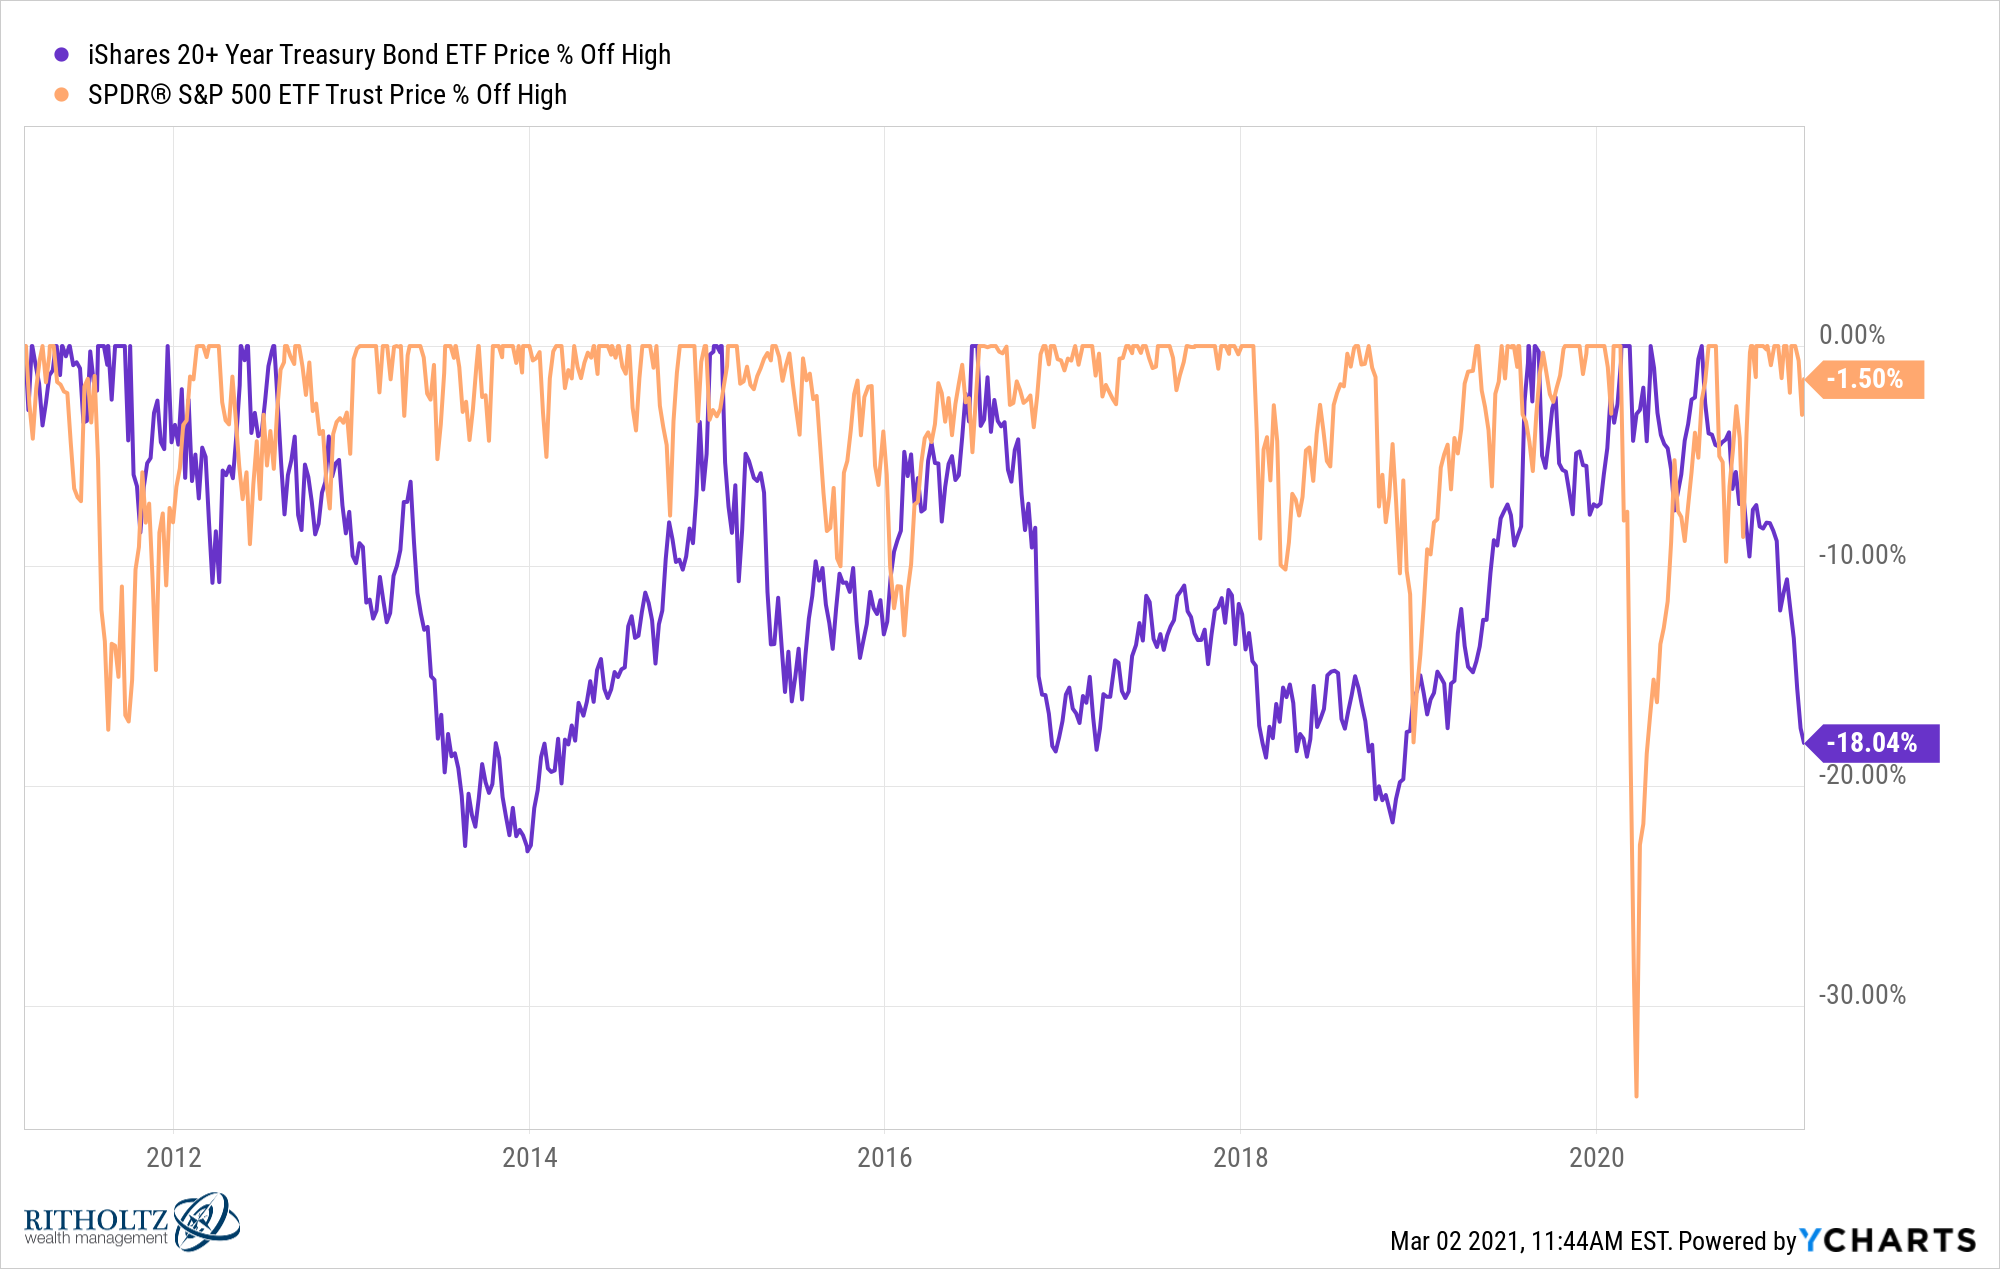
That includes losses of 23%, 15%, 18%, 22% and 18% (the current drawdown).
Those are enormous losses for such little yield.
And the S&P is up almost 200% in that time versus a gain of 52% for long-term bonds.
From current yield levels, long-term government bonds are almost assuredly going to have as many or more double-digit corrections as the stock market over the next 10 years as well.
Now look at the drawdown profile for the 3-7 year ETF (IEI) versus the 20-30 year ETF (TLT):
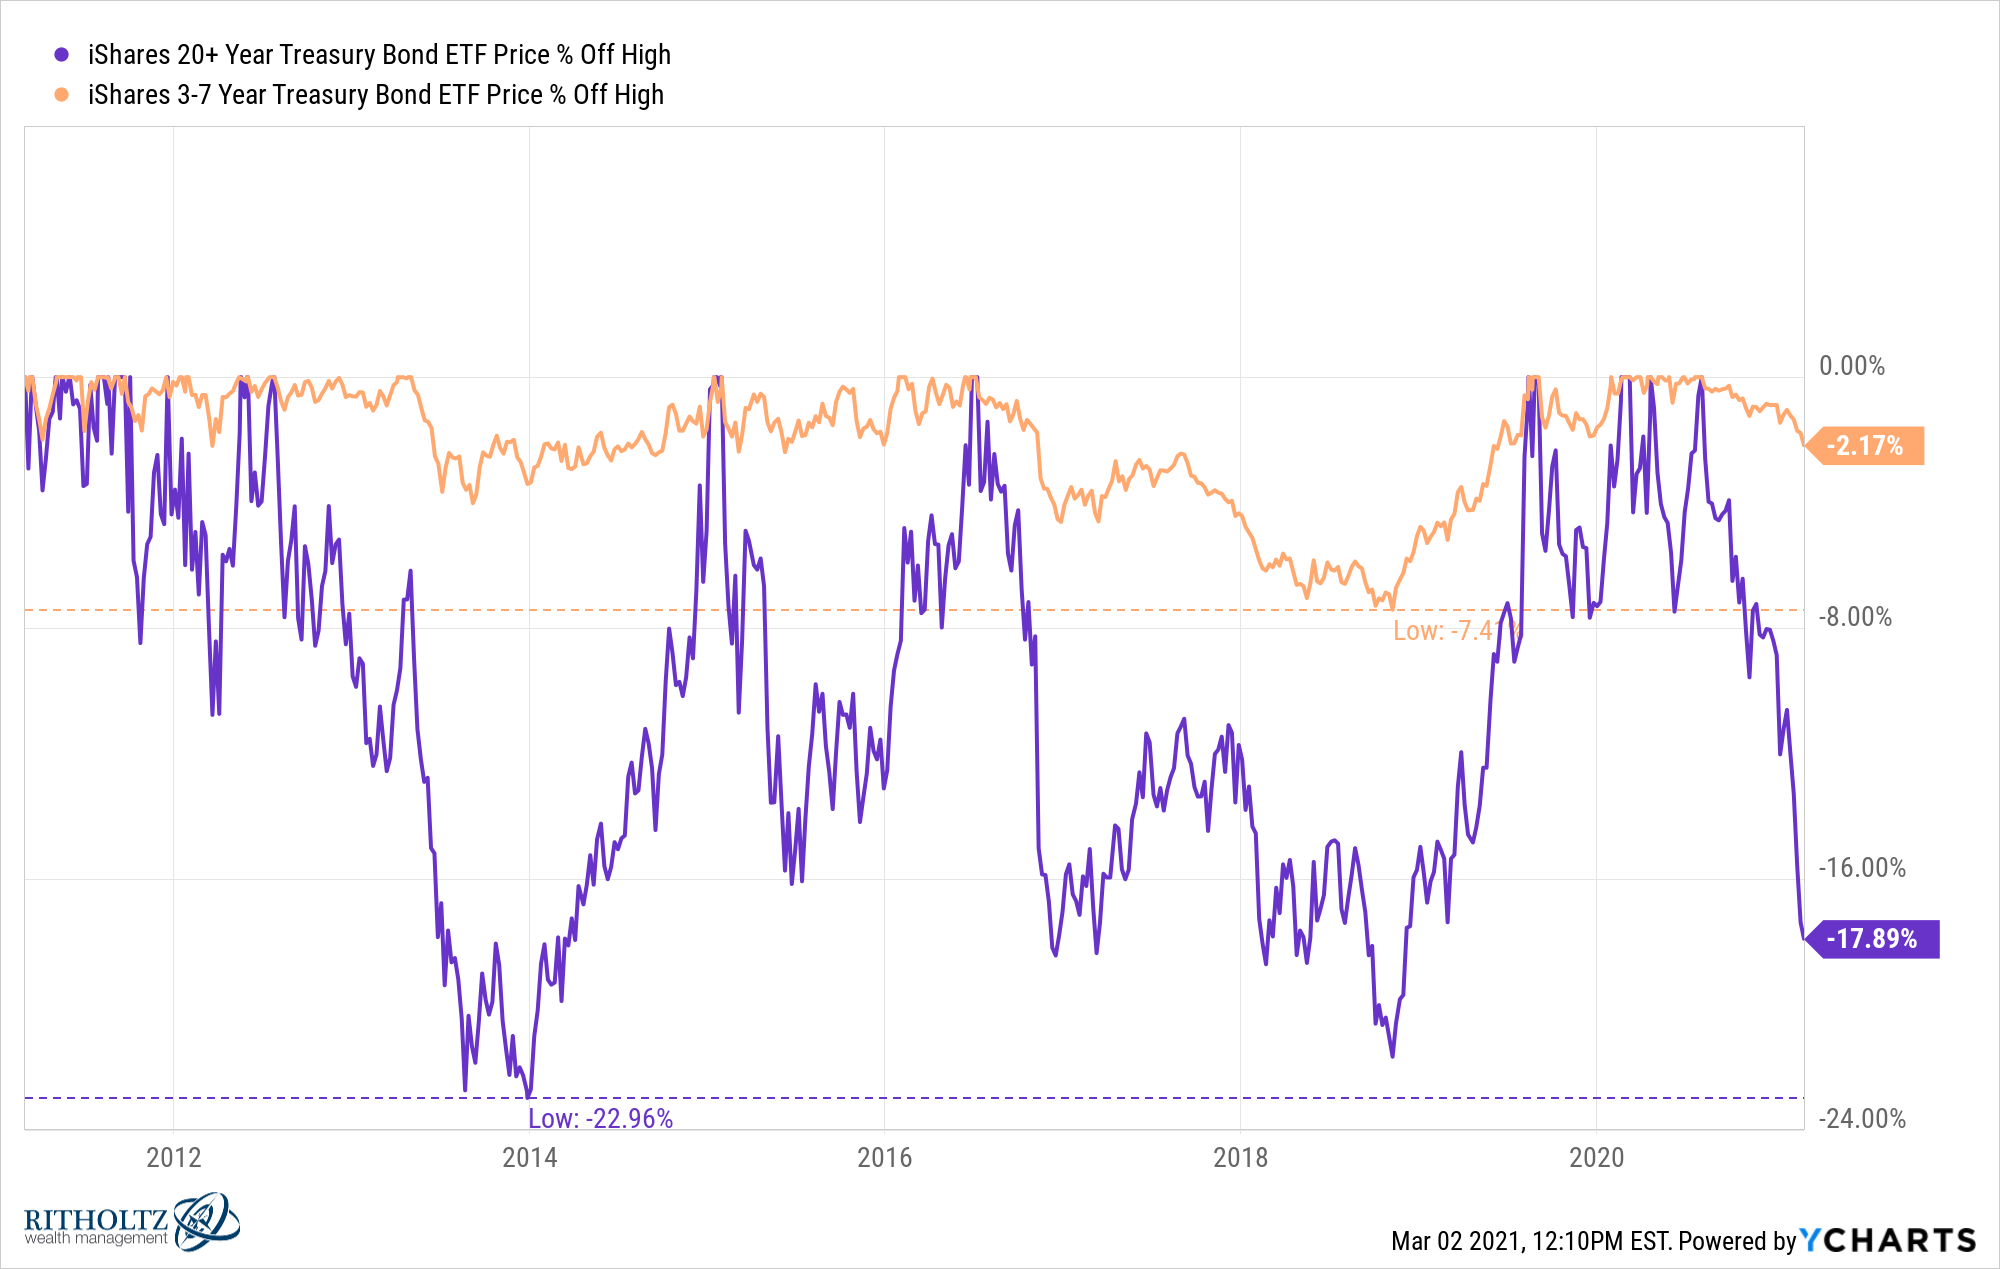
Not a single double-digit drawdown for intermediate-term bonds.
The current yields for these two products are 1.8% and 0.4%, respectively. That’s a pretty decent yield differential but think about the added risk you’re taking on to earn an additional 1.4% in yield.
I don’t know if we’re in the midst of a rising rate environment or if this is simply another head-fake. People have been predicting higher interest rates for 20+ years and all they’ve done is continue to fall.
But if rates do increase in a meaningful way, I would expect long-term government bonds to not only provide a bumpier ride, but to underperform intermediate-term bonds as well.
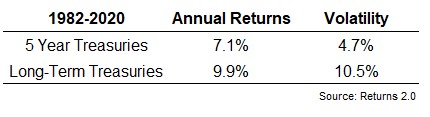
In 1950, the 10 year treasury yielded just 2.3%, not much higher than the current yield of around 1.4%. By 1981, the 10 year yielded 13.7%.1
These were the annual returns and volatility levels for 5 year treasuries and long-term government bonds during this time:
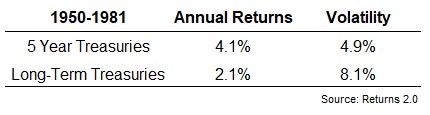
So you got half the returns with double the volatility. This is not exactly the experience bond investors have faced in the cycle ever since then as rates took the elevator down:
A similar volatility profile but now you had the tailwind of falling rates as opposed to the headwind of rising rates.
I’m not suggesting we’re going to see a similar rise in rates as we saw in the 1950s to 1980s time frame. Never say never but that it would be a tad premature to make that call.
But it is safe to say investors are going to experience much more volatility in long-term bonds in the years ahead and you’re not exactly being compensated for that increased volatility at current interest rate levels.
You can get a better sense of the volatility profile between long duration and intermediate duration bonds by looking at the worst calendar year returns as well. Here are the 10 worst losses for each going back to 1926:
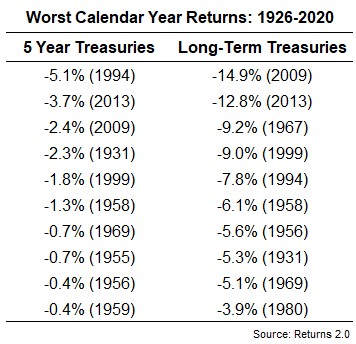
The worst calendar year loss for 5 year treasuries over the past 95 years or so was just 5%. Long-term treasuries don’t have the same loss profile as the stock market but it’s much worse than intermediate-term bonds.
I have no idea about the path for interest rates going forward. Anyone who tells you they do is lying.
But you can set return expectations based on current yields and you can be certain long-term bonds will deliver a much more volatile ride than shorter-term bonds, regardless of their yield.
I know it’s not exciting to talk about bonds in the midst of a raging bull market but they’re going to matter eventually.
Bond investors have had it pretty easy the past 40 years or so. From current levels of interest rates things will be much more challenging going forward.
Further Reading:
Why Would Anyone Own Bonds Right Now?
1And got as high as more than 15% that year.

