Historical market data can’t help you predict the future but I still find it useful as a way to understand the potential risks and rewards you can see as an investor.
One of my favorite free sources of historical returns comes from NYU’s Aswath Damodaran. Each year he updates the annual returns for stocks (S&P 500), bonds (10 year treasuries) and cash (3-month t-bills).
I always find something interesting when perusing this data.
Here are the performance numbers for 2020:
Stocks +18.0%
Bonds +11.3%
Cash +0.1%
And the annual returns from 1928 to 2020:
Stocks +9.8%
Bonds +4.9%
Cash +3.3%
Damodaran also includes the inflation rate in his data which allows you to view real returns. In these 93 years the annual inflation rate was 3%, meaning the real returns were as follows:
Stocks +6.8%
Bonds +1.9%
Cash +0.3%
While performance numbers over nearly 100 years can help provide context in terms of risk premiums — stocks should outperform bonds which should outperform cash — averages can mask market cycles.
Take a look at how cyclical the stock market has been:
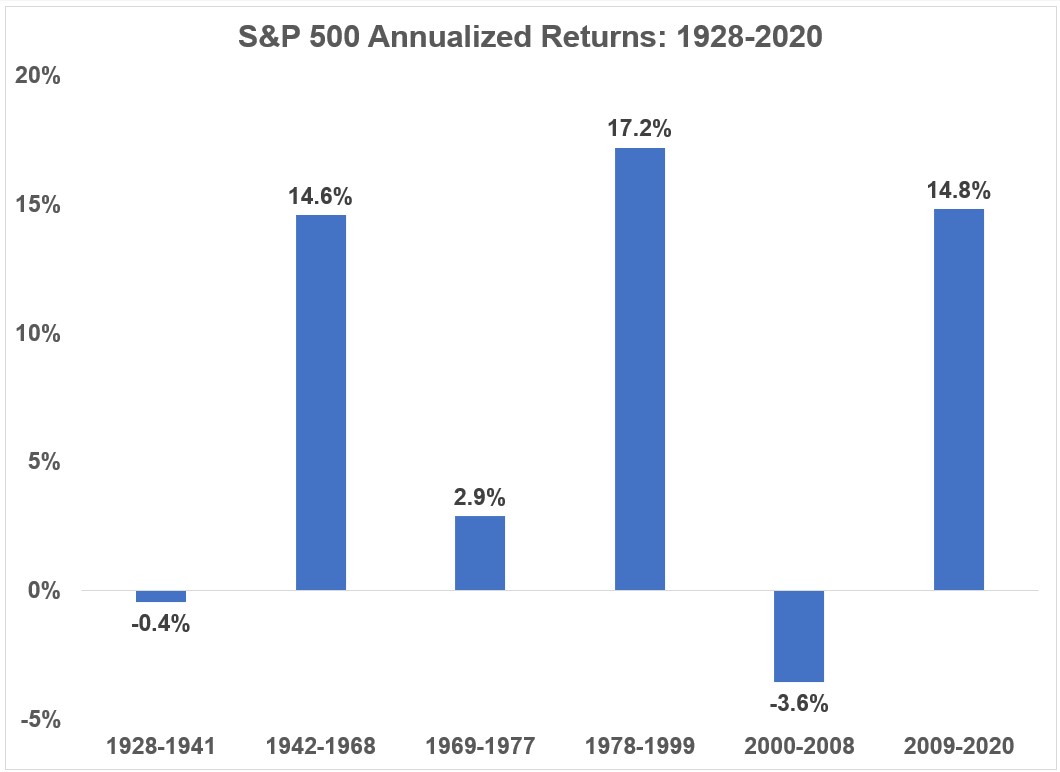
The start and end dates are cherry-picked here but the results are the results.
Now look at the corresponding annual volatility of these return cycles:
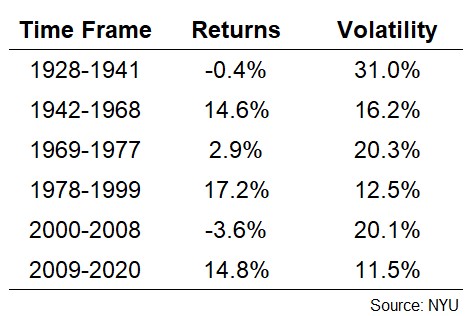
The thing that stands out is just how long some of these cycles, both good and bad, have lasted. And when the stock market offers poor returns you’re also penalized with higher volatility. It’s a double-whammy.
That’s why it’s called a risk premium, not a return premium.
Now let’s compare these stock market cycles to bonds, cash and inflation:
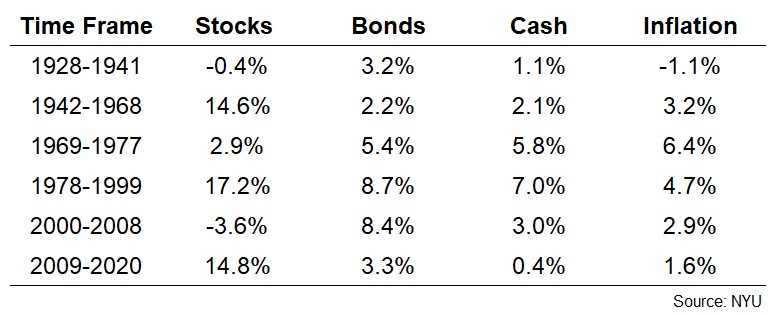
The 1970s were actually worse than the 1930s when it comes to real returns. When you take the deflation into account, real returns from 1928-1941 were actually higher while the 1969-1977 returns were negative for stocks, bonds and cash after inflation.
Also, look at how lucky investors were in the 1980s and 1990s. Everything worked and gloriously so.
Interestingly enough, the current cycle looks eerily similar to the 1942-1968 set-up. We could count ourselves lucky if it lasts just as long.
Cash is trash as a long-term investment because it will lose money to inflation so the fact that it’s actually beat the stock market over cycles of 14, 9 and 9 years says more about the risk involved in the stock market than anything.
Cash is the most boring of asset classes but there are some interesting results in the long-term numbers.
The 3-month t-bill is a decent proxy for a savings account. Cash returns have been below 2% in every calendar year since 2008, with an average annual return of just 0.6% from 2008-2020.
Surprisingly, cash returns this low have happened before. In fact, from 1932 to 1955, cash returned just 0.7% per year.
Then from 1956 to 2007, cash returned 5.3% a year.
So what’s the aberration — 1932-1955 and 2008-2020 or 1956-2007?
I don’t know but I’m leaning towards the former rather than the latter.
The big reason those cash returns were so much higher in the decades leading up to 2008 is because interest rates were much higher.
One worry for fixed income investors is what happens if and when interest rates begin to rise since bond prices and rates are inversely related.
It’s important to remember a bad day in the stock market is basically a bad year in the bond market:
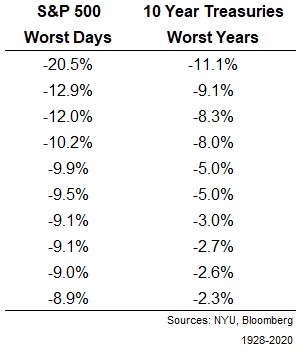 Shockingly, 10 year treasuries have had just one double-digit loss in a calendar year going all the way back to 1928.
Bonds are used as a portfolio stabilizer for a reason.
Two of the worst 10 days in stock market history occurred in the 2020 Corona crash (-12.0% and -9.5%). So a single day in the U.S. stock market last year experienced a larger loss than U.S. government bonds have experienced over an entire year.
Looking through 93 years of returns for stocks, bonds and cash won’t help you predict future returns for these asset classes.
But it can give you a better sense of the risk involved in these asset classes since risk is much easier to predict than returns.
Further Reading:
The Best Free Investing Tools on the Web

