The first quarter of 2020 saw the S&P 500 fall 19.6%.
The second quarter of 2020 saw the S&P 500 rise 20.5%.
Add this up and on a total return basis the U.S. stock market was down just 2.7% through the first half of the year.
With everything that’s going on in the world this year, being down less than 3% feels miraculous.
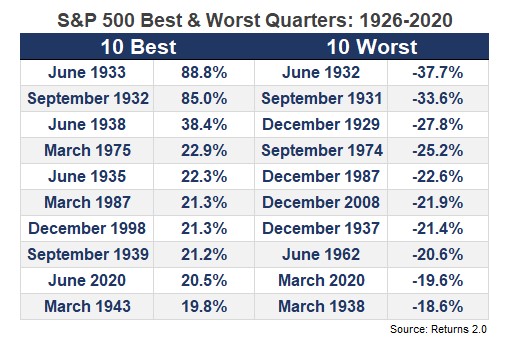
The first quarter of the year was so bad and the second quarter of the year was so good that both fall into the top 10 for the best/worst quarters ever since 1926:
The usual suspects are on this list in terms of horrid market environments. You should also notice many of the biggest gains and losses clustered around the same years. Volatility is an equal-opportunity rollercoaster.
In 2020, one of the worst quarters of all-time followed by one of the best quarters of all-time.
While this situation is rare, it’s not out of the question for the stock market to see these types of large swings back and forth.
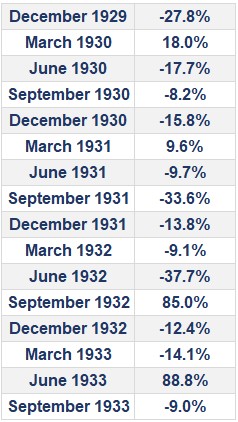
The Great Depression was littered with some of the best and worst quarters in stock market history and it wasn’t just one or two:
There wasn’t one “normal” quarter over this entire four year period. It was one massive loss or gain after another.
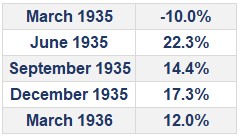
The mid-1930s saw another run of double-digit quarterly moves, most of which were to the upside:
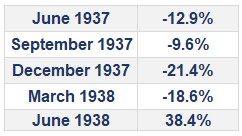
The mirror image of this stretch was the echo bear market of 1937-1938:
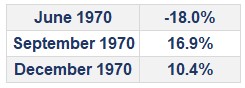
The end of the Go-Go years saw some big moves as well:
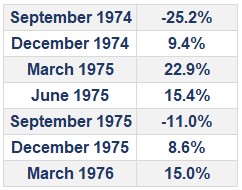
Then there was the bear market of the mid-1970s:
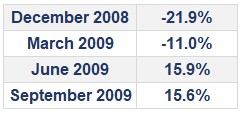
And finally, the end of the Great Financial Crisis:
Even the mini-bear market of late-2018 saw a 4th quarter dive of 13.5% followed by a 13.7% increase in the 1st quarter of 2019.
So these moves happen.
2020 is unprecedented for the number of times people have called it unprecedented. And this year certainly is unique. But stock market volatility is not.
The reasons change but big moves in the stock market are nothing new.
A Wealth of Common Sense is a blog that focuses on wealth management, investments, financial markets and investor psychology. I manage portfolios for institutions and individuals at Ritholtz Wealth Management LLC. More about me here. For disclosure information please see here.
Get Some Common Sense
Categories
Get a Full Investor Curriculum: Join The Book List
Every month you'll receive 3-4 book suggestions--chosen by hand from more than 1,000 books. You'll also receive an extensive curriculum (books, articles, papers, videos) in PDF form right away.