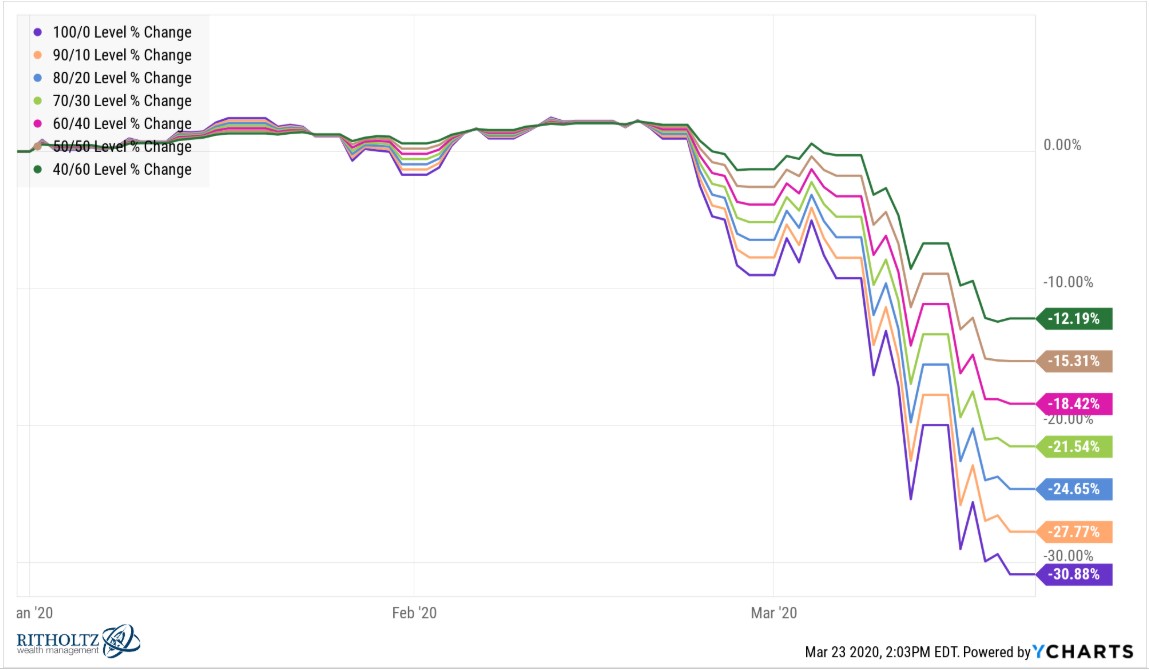
Through the close of business last Friday a globally diversified basket of stocks is down roughly 31%.
2020 has not been kind to investors but most investors don’t have all of their money in the stock market.
Here are the year-to-date returns for a number of different asset allocations using a simple Vanguard 3-Fund1 portfolio:

Being in an all-stock portfolio is painful this year but if you’re a retiree or risk-averse investor with a 60/40, 50/50 or 40/60 portfolio, these losses aren’t big enough to wipe you off the map just yet.
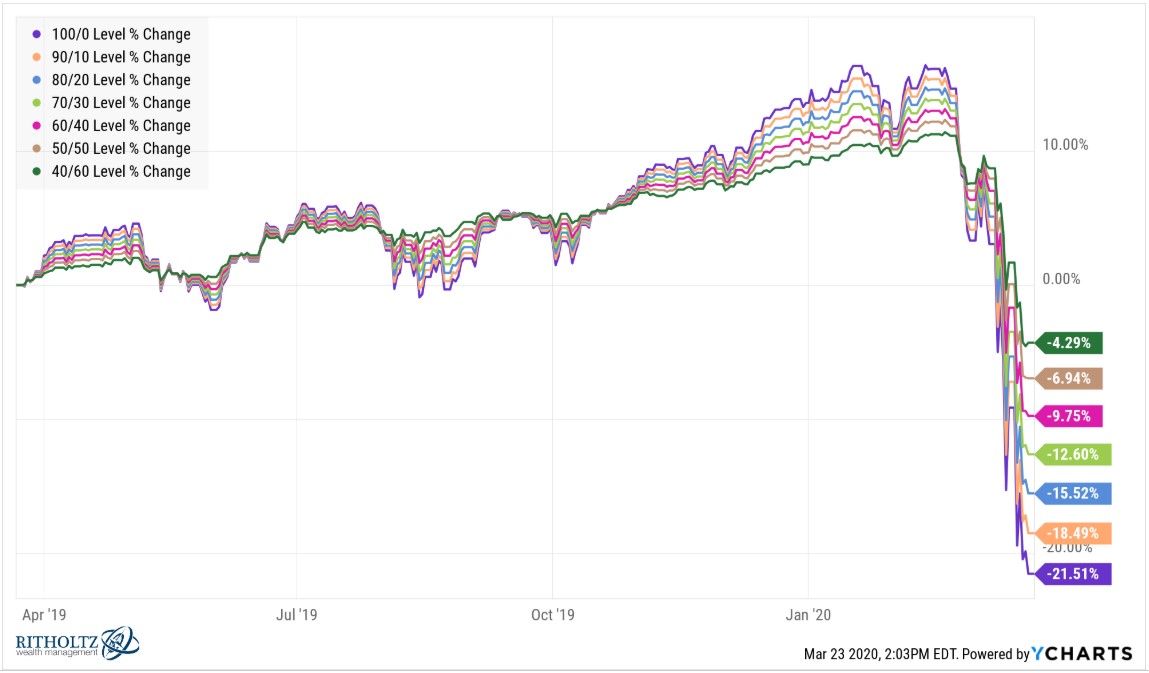
Now here’s what things look like over the past year:

The waterfall of losses has been brutal but everything 70/30 and down has held up reasonably well. Even an 80/20 portfolio is down just 15% and change. It feels like the world is ending at the moment but these are not end-of-the-world-like returns.
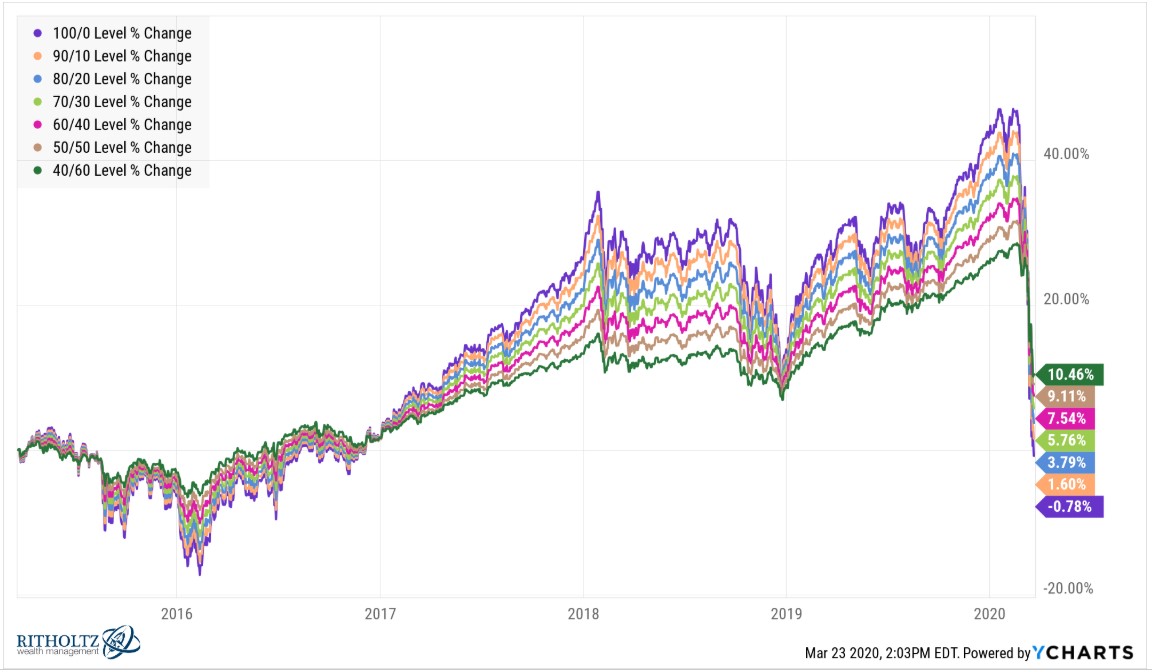
Losses have been so severe over the past month or so that even going 5 years out shows the most conservative portfolio with the best returns:

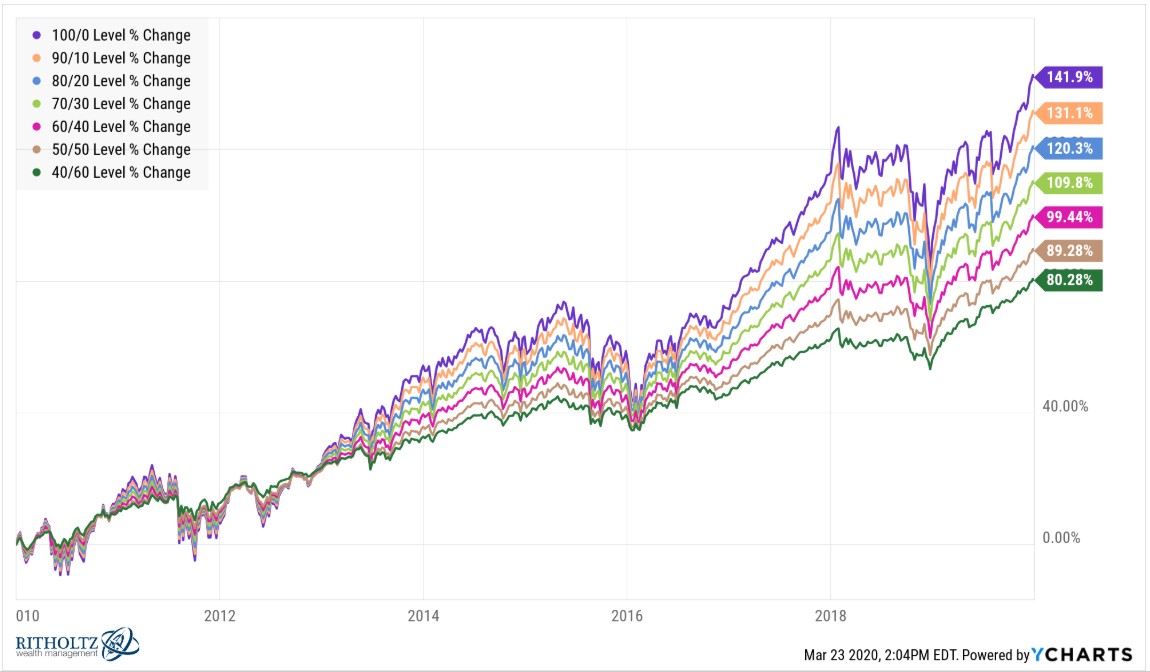
Of course, a lot of this has to do with measuring performance following a colossal crash. Ten year returns through the end of 2019 told a much different story:

The bill is now coming due for the large returns on an all-stock portfolio over the previous ten years through 2019. This is the whole point of risk and reward. You cannot separate them as an investor.
If you want higher returns, you must accept a higher probability of large losses or other unforeseen risks. And if you want to dampen large losses, you must accept the prospect of lower returns. There is no stronger relationship in all of investing than risk and reward.
And the whole point of asset allocation is calibrating your personal risk profile with your portfolio holdings.
This example uses simple asset classes for portfolio construction purposes and doesn’t drill down into any other strategies, risk factors, or tilts. But even stocks and bonds alone often provide a powerful diversification benefit over the long-term.
Looking back at the annual returns of the S&P 500 and 5-year U.S. treasuries going back to 1926, I found just two instances where both finished the year with a loss. In 1931, the S&P finished the year down 43.4% while 5-year treasuries fell 2.3%. Then in 1969, stocks declined 8.5% while intermediate-term bonds were down 0.7%.
Every other instance over the past 94 years, at least one of these two assets finished the year in positive territory.
Some investors may assume stocks and bonds are negatively correlated because bonds tend to act as a hedge when stocks fall. And this year they are doing just that, even though at the moment they’re not up a whole lot. In 61 out of 94 years through the end of 2019, both stocks and bonds rose concurrently. That’s 65% of the time where both asset classes offered gains in a given year.
Things are somewhat different today in that the 5-year yields just 0.5% at the moment. There’s not much of a buffer there for losses if rates ever meaningfully rise in a given year.
Bond returns will be much lower in the coming years because of their paltry yields. But this year is proving they can still act as a valuable hedge against stock market losses.
If you’re someone who is retired or fast approaching retirement, intelligently designed asset allocation is still your best hedge against a declining stock market.
Further Reading:
Do Stocks Diversify Bonds?
1I built these portfolios using total stock and bond index funds (VGTSX, VTSMX and VBMFX) and weighted the U.S. and international holdings 50/50 since that’s basically what the world stock market weighting is.
