A podcast listener asks:
You’ve touched upon this previously and there’s a slew of articles out there, but can you earnestly break down who has the most impressive track record of them all. All things considered, is it Simons, Klarman, Druck, Thorp, Lynch, or someone else?
This feels a bit like one of those Jordan vs. LeBron debates on sports talk radio but I’m sick of arguing about the yield curve so let’s do this.
I knew the answer to this one without even running the numbers but I had to run the numbers anyway just to prove my point.
But before we get to the winner, here’s why I didn’t choose some of the other candidates.
Jim Simons at Renaissance Technologies has the most mysterious track record because people still don’t know how the hell he and his gaggle of PhDs and rocket surgeons do it (which is why I’m intrigued by the new Gregory Zuckerman book about him coming out soon).
Simons is a great choice but he’s out because the main fund he runs has been closed to outside capital for years. He smartly realized early on his process had limits in terms of assets under management.
Soros and his protege, Stanley Druckenmiller, each have unbelievable long-term track records. The biggest strike against them in this debate is that they never managed nearly as much money as the person I chose.
Peter Lynch is one of the greatest mutual fund managers of all-time but he went out relatively early in his career and some would say you could poke holes in his track record.
That leaves one person and I’m sure you won’t be surprised to know I chose Warren Buffett.
Here’s my thought process:
Before running Berkshire Hathaway, Buffett ran an investment partnership for a small group of individual investors and families. Reported returns from 1957-1968 were 25.3% annually (31.6% before fees, which were 25% of any gains above a 6% hurdle) vs. around 9% per year on the Dow.
Towards the end of this partnership, Buffett turned Berkshire Hathaway into his investment vehicle of choice.
Since then Berkshire Hathaway has more than doubled up the annual returns on the S&P 500 — 20.6% annually vs. 9.6% annually from 1965-2018.
But even those staggering annual returns don’t tell the whole story.
The total returns over this time frame were nearly 2.5 million percent for BRK vs. 14 thousand and change for the S&P 500.
Compounding capital for that long leads to some serious return numbers. The market’s returns of nearly 10% per year over 5 plus decades are great. Buffett’s returns are otherworldly.
The fact that he was able to do it for this long is perhaps the most impressive aspect of his track record. And the fact that he was able to grow the market cap of the company to almost $500 billion is what sets him apart from any other investor on the planet.
You want more? Ok, here’s more.
Lately, Berkshire Hathaway hasn’t done as well against the market that it did in the past:
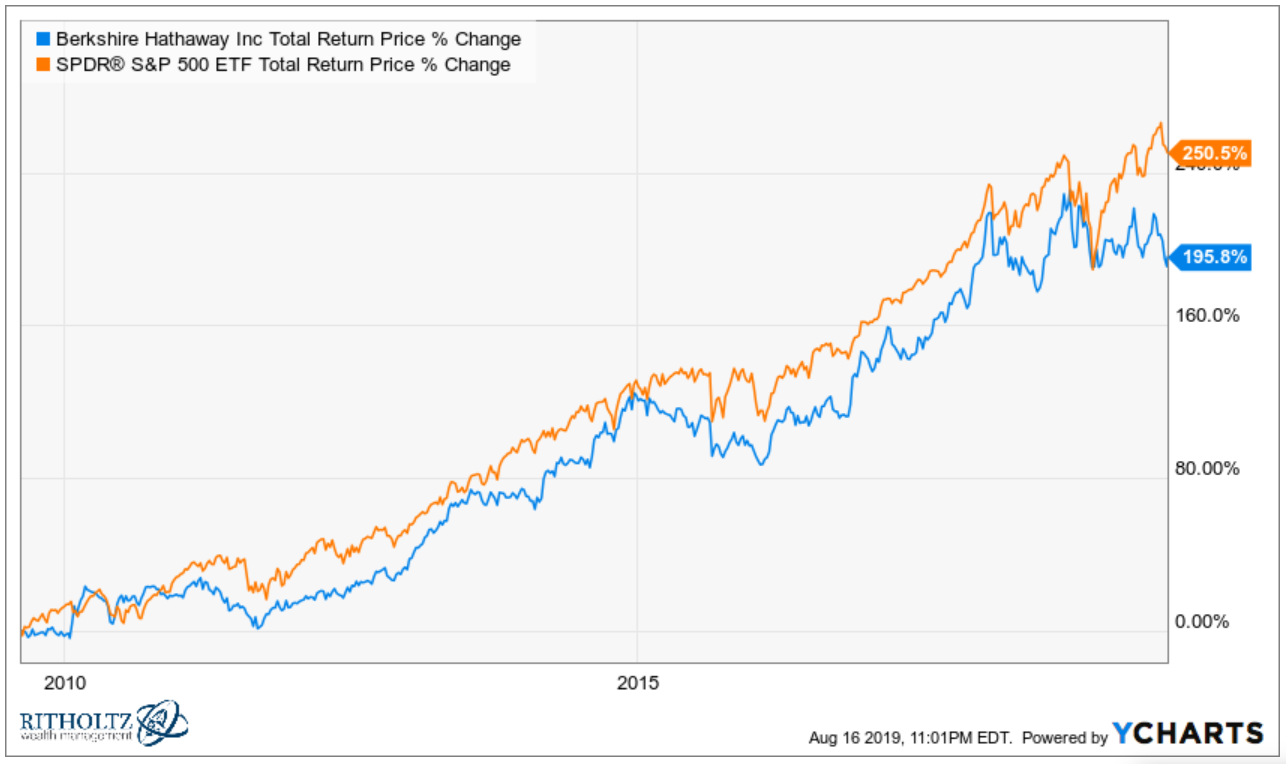
Considering how poorly value investing has been performing lately, you could argue this isn’t so bad.
But the fact that Berkshire has underperformed over the last decade makes the early-Buffett track record even more impressive.
One of the surprising things I found when digging into the number is the staggering size of the gains Buffett has produced over the years. Here’s a breakdown of the calendar year returns versus the S&P 500:
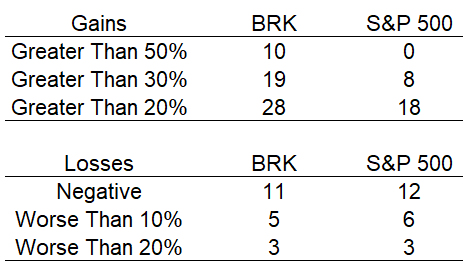
During those 12 down years for the S&P 500, Berkshire was actually in positive territory in half of them. The average loss for the market was 13% or so, while Buffett was up almost 2% on average.
The number of calendar year losses is similar to the S&P 500 overall but the gains dwarf the overall market in terms of magnitude.
Of those 10 calendar year gains in excess of 50%, five of them were more than 80%, with two being more than 100%.
Buffett’s worst performance came during the brutal 1973-1974 bear market, when Berkshire lost 50% versus a loss in the S&P 500 over those two years of just shy of 37%.
The returns following this period of underperformance are a sight to behold. From 1976-1989, Berkshire Hathaway was up more than 21,000 percent or nearly 47% per year. For 14 years Buffett did almost 50% per year!
The market was up big during this period as well, but the 620% total return and 15.1% annual performance pales in comparison.
Buffett’s most well-known period of underperformance came in the late-1990s during the dot-com bubble. It wasn’t as bad as people make it out to be, save for one bad year.
In 1999, Berkshire was down 20% while the S&P was up 21%. However, from 1995-1998, Berkshire handily outpaced the S&P, gaining 243% vs. 188% for the index.
After that bad year in 1999, Berkshire went on a relative tear.
From 2000-2002, during a nasty bear market, Berkshire was up almost 30% while the S&P 500 fell more than 37%. From 1995-2002, Buffett outpaced the S&P 500 257% to 118%.
Yes, returns since then haven’t been nearly as good but Buffett himself admits size is the enemy of outperformance.
There have been endless pieces written about how Buffett was able to pull this off.
I’m not going to re-hash all of that but the fact Buffett was able to put together such high returns over more than 6 decades of investing makes it easily the greatest investment track record of all-time.
Further Reading:
The Buffett Backlash
