Japan is fascinating to me from a markets perspective. They had what I consider to be one of the biggest bubbles of all-time in the 1980s (it’s a close call with the South Sea bubble). Interest rates have been on the floor ever since. The country has had no inflation to speak of going on three decades now. Yet they still have one of the biggest economies on the planet. The unemployment rate is less than 3%.
Some are worried the U.S. is heading down a similar route. This piece I wrote for Fortune looks at why I don’t think this is the case.
*******
Ruchir Sharma, the Chief Global Strategist for Morgan Stanley, is worried easy money from the Fed could cause an economic crisis in the United States similar to the three-decade malaise of deflation and low growth experienced in Japan. Sharma shared the following in The New York Times:
In this environment, cutting rates could hasten exactly the outcome that the Fed is trying to avoid. By further driving up the prices of stocks, bonds and real estate, and encouraging risky borrowing, more easy money could set the stage for a collapse in the financial markets. And that could be followed by an economic downturn and falling prices — much as in Japan in the 1990s. The more expensive these financial assets become, the more precarious the situation, and the more difficult it will be to defuse without setting off a downturn.
It’s certainly possible the Fed could be blowing bubbles by continuing to keep interest rates low. Valuations are already at nosebleed levels in U.S. stocks and no one really knows what the impact will be from a decade or so of keeping rates on the floor.
But it’s important to draw some distinctions between the markets in Japan back in the 1980s and what’s going on in the U.S. today.
While it’s true U.S. stocks have had an unbelievable run over the past 10 years or so, it pales in comparison to the magnificent bubble in Japan during the 1980s. In his book Devil Take the Hindmost, Edward Chancellor provides many anecdotes and stats that show how insane the Japanese real estate and stock market bubble was in that time:
- From 1956 to 1986 land prices increased 5000% even though consumer prices only doubled in that time.
- In the 1980s share prices increased 3x faster than corporate profits for Japanese corporations.
- By 1990 the total Japanese property market was valued at over 2,000 trillion yen or roughly 4x the real estate value of the entire United States.
- The grounds on the Imperial Palace were estimated to be worth more than the entire real estate value of California or Canada at the market peak.
- There were over 20 golf clubs that cost more than $1 million to join.
- In 1989 the P/E ratio on the Nikkei was 60x trailing 12-month earnings.
In the 10 year period from 1980-1989, the MSCI Japan Index was up 1142% or nearly 29% per year. And that’s after it was up nearly 400% (17.4% per year) from 1970-1979. Through the end of June 2019, the S&P 500 is up 14.7% per year (300% in total). The 10 years prior to that, the S&P was down 20% or more than 2% per year. One of the biggest reasons U.S. stocks are up so much over the past 10 years is because they performed so terribly in the preceding 10 years. This is more about mean reversion than a runaway bubble.
A $100,000 investment in Japanese large-cap stocks in 1970 would have turned into $5.7 million by 1989. A $100,000 investment in large-cap U.S. stocks in 1999 would have turned into less than $315,000 by June 2019. This is one of the reasons the overhang in Japan was so severe. They pulled forward decades and decades of returns. We have a long way to go to ever catch up to the atmospheric rise in Japanese financial assets.
Until they began raising interest rates in late-2015, the Fed effectively kept short-term interest rates at zero for nearly a decade. Although the stock market recovered mightily in this time, it doesn’t appear the U.S. consumer went on a crazy borrowing spree.

Household debt to GDP has fallen substantially as consumers have slowly but surely repaired their balance sheets following the worst credit crisis since the Great Depression. This means there is now more income available to service household debt. If anything, U.S. households were taking more credit risk during the housing bubble even though yields were higher as the Fed began raising rates in the mid-2000s.
And according to the Federal Reserve Bank of New York, the quality of debt people are taking on is also improving. Fewer people are taking out mortgages from the peak housing bubble years but much of the drop off has come from borrowers with low credit scores:
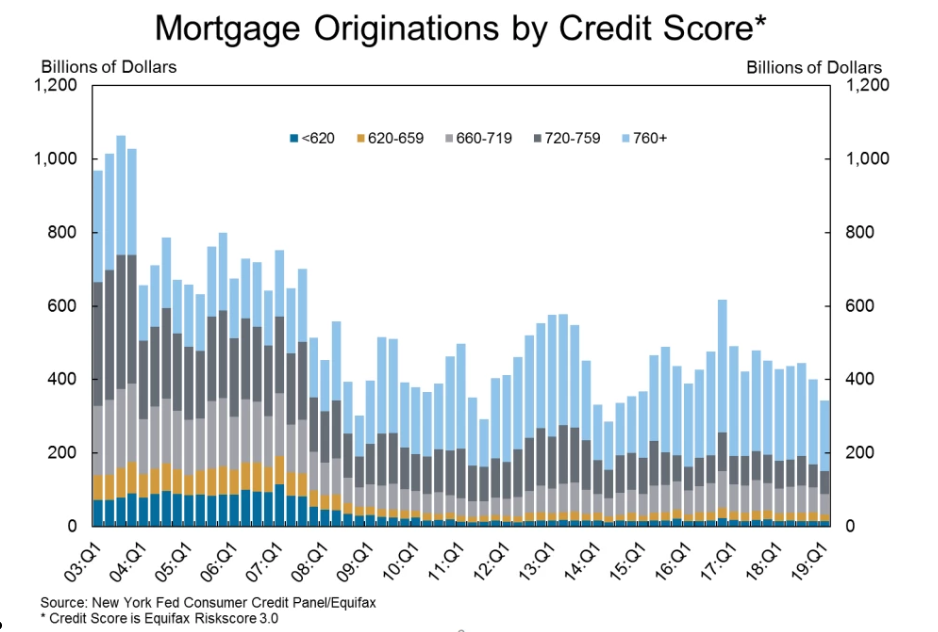
One of the reasons things got so out of hand during the Great Financial Crisis of 2007-2009 is because the debt was being issued hand over fist to low-quality borrowers. A combination of high debt levels with lower income and credit quality meant the first signs of trouble in the housing market sent borrowers into a tailspin. Both the debt service level and credit quality of borrowers have improved in the aftermath of the crisis.
All of this is not to say that the U.S. can’t or won’t experience downturns or credit busts in the future. Anything is possible. But the U.S. has a long way to go to reach the levels of craziness that were exhibited in Japan in the 1980s or even here in the mid-2000s.
This piece was originally published at Fortune. Re-posted here with permission.
