Last week I wrote about how diversification is (almost) undefeated by showing how your chances of seeing a positive return in both stocks and a simple 60/40 stock/bond portfolio have gone up historically as you extend your time horizon:
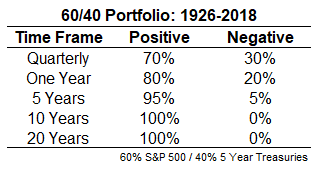
Because this was a US-centric portfolio, the obvious follow-up question (which many of my astute readers asked) is: How do these numbers look for foreign stocks?
The U.S. has handily outpaced the rest of the globe for the past decade or so which has made anyone diversifying globally nervous about their foreign equity allocation. Fortunately, the long-term history of international stocks looks pretty good.
I ran the numbers on the MSCI World Ex-US Index, MSCI Europe and MSCI Pacific1 to show the probabilities back to 1970, which is as far back as MSCI data goes:
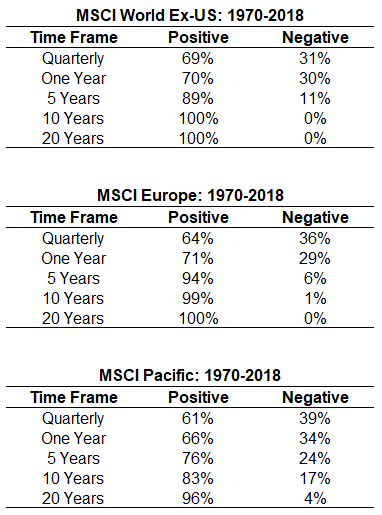
The long-term numbers tell basically the same story as the US historical return probabilities — the longer you wait, the better your chances of seeing positive outcomes in the stock market. It is worth noting that the MSCI Pacific Index is heavily weighted in Japanese stocks.2
Japan has had an unbelievably bad 30 year stretch for returns since peaking out in 1989, making it the poster child for long-term risks in stocks (see Michael’s recent post on Japan). Even with the awful run Japanese stocks have had since the 1990s, investors still gave themselves a much better opportunity to see gains by extending their time horizon.
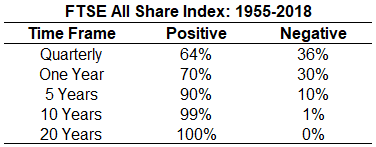
The FTSE All-Share Index, which includes all companies listed on the London Stock Exchange, goes back a bit further than the MSCI indexes, but the results are similar:
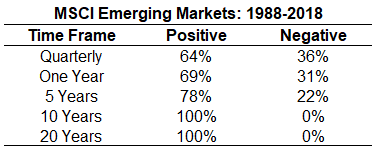
There’s not nearly as much history in the developing countries, but here are the numbers for emerging markets:
These results show how things looked for the individual regions or indexes over time but you can get a better sense of how the diversification benefits apply by looking at how the rolling returns change over time by region. Here are the rolling 10 year total returns for the S&P 500, MSCI World ex-US, MSCI Europe, and MSCI Pacific:
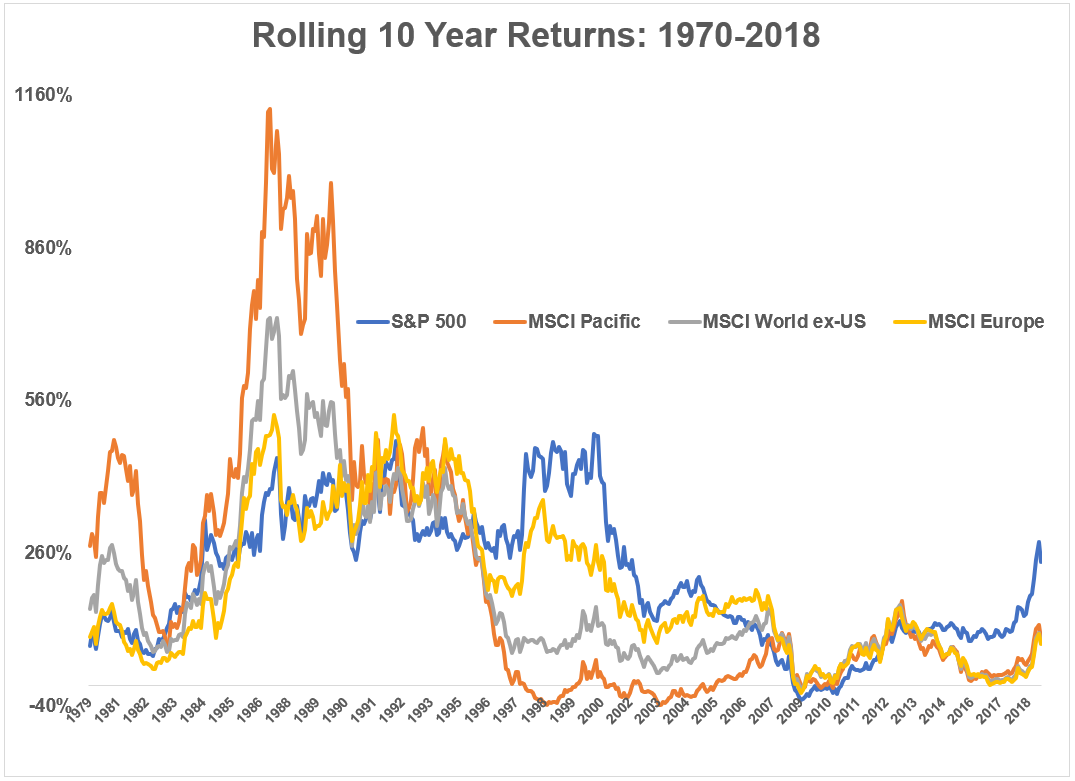
Now we can see some glaring divergences:
- The 1970s and 1980s saw Pacifics stocks, led by Japan, annihilate US and European stocks, which also lifted the performance of the World ex-US.
- The 1990s were dominated by US stocks, and the meanest reversion of all led to the horrible performance in Pacific stocks we discussed earlier.
- The 2000s were unkind to the S&P 500, as it finished the 2000-2009 period with a negative return. International stocks picked up the slack somewhat and outperformed on a relative basis for much of that time frame.
- Now you can see the divergence once again as US stocks have handily outpaced the rest of the world over the past decade.
The downside of diversifying across these different regions of the world means you would always own some of the worst performers in the group. But the upside is you’d also own some of the best performer, and you would never have all of your money in the worst. The whole point of risk management is avoiding blowing yourself up, and diversification does just that.
Regardless of your feelings about investing outside of the US, the data clearly shows that the more patient you are with your stock holdings, the higher the probability you have of seeing gains over time.
It’s also important to point out the reverse here — the shorter your time horizon, the greater likelihood you have of experiencing losses in stocks. This is an important distinction for those who need to use their portfolios for current spending needs. The stock market gives you the best odds of compounding your capital at high rates of return over the long run, but anything can happen in the short run.
Diversify accordingly.
Further Reading:
Diversification is (Almost) Undefeated
1For periods beyond quarterly performance, I used rolling monthly returns for the calculations.
2Currently around 67%, with 19% in Australia, 11% in Hong Kong and the rest in Singapore and New Zealand.
