A reader asks:
Can this chart be updated easily? Also, are the stats similar for a 60/40 portfolio as they are for just the stock market? This scatterplot would also be cool to see redone with a balanced portfolio.
The chart in question here is one I’ve used on a number of occasions, which shows the historical probability of seeing positive returns1 in stocks by different time frames:
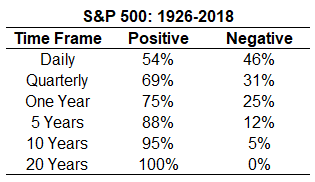
This is one of best illustrations of the power of long-term thinking in the markets. On a daily basis, it’s more or less a coin flip between being positive or negative but the further out you extend the time horizon the better your chances of success.
Some caveats always apply to numbers like these — the U.S. is fairly unique compared to foreign markets, no costs or inflation are considered, and there’s nothing that says the future must look exactly like the past. Still, the numbers are what they are and they’re impressive.
I ran the same numbers (sans daily returns since I don’t have those for bonds going back that far) on a 60/40 stock/bond portfolio using the S&P 500 and 5 year treasuries:
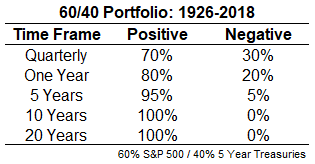
Quarterly and one year numbers have similar win percentages as stocks but the longer-term numbers are even better. I was surprised to see not a single negative return over 10 years but even 5 years out was positive 9.5 out of every 10 years.
Of course, there was a wide range in the actual performance numbers in this time as you can see from the best and worst total returns2 over 10 years:
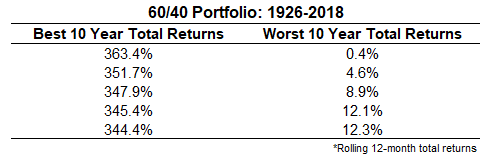
The worst 10 year performance on a total return basis was barely positive, up just 0.4%. Over 20 years, the worst gain was around 90% in total. You almost couldn’t ask for better results than these over nine decades or so.
I also ran the inflation-adjusted numbers for those who are into that sort of thing:
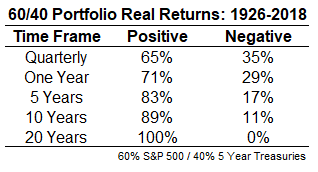
Even when you account for inflation, it’s hard to argue with these historical probabilities.
Now here’s the scatterplot of the calendar year returns:
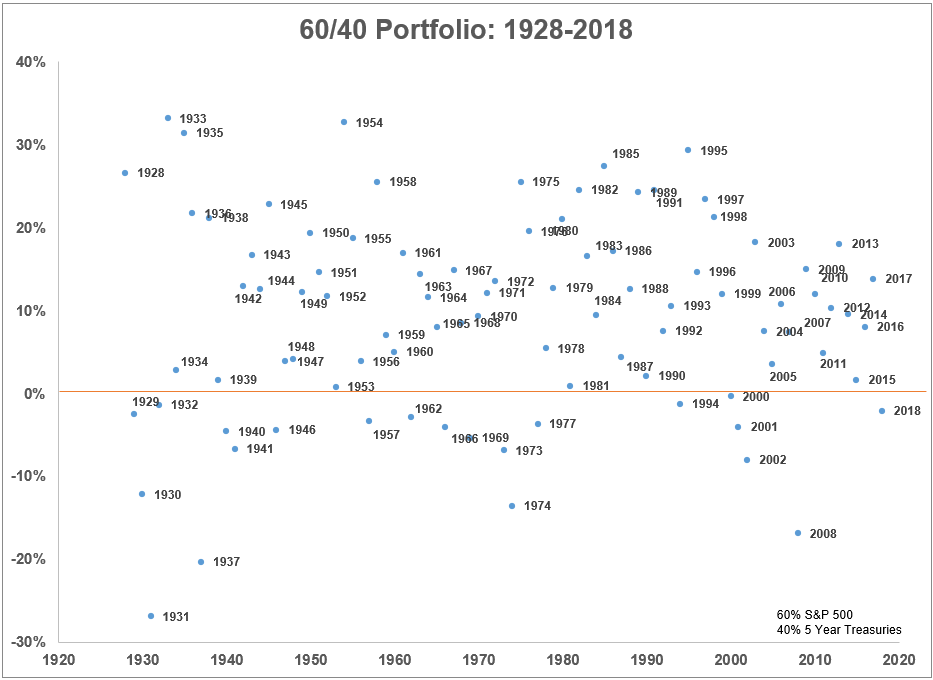
2018 was a down year for the 60/40 portfolio and some people assume this is a foreshadowing of things to come. It does make sense to bring down your expectations based on current interest rates and the massive run U.S. stocks have had over the past decade or so.
But it’s also important to remember there probably isn’t a single investor on the planet who actually has their money perfectly aligned with a U.S. 60/40 stock/bond mix. The 60/40 works as a good bogey for comparison purposes but most investors also hold cash, foreign stocks, different strategies, and other asset classes in various combinations for their asset allocation.
The markets don’t owe investors anything and there will surely be periods in the future that are completely off the map in terms of these numbers. Outliers are always a possibility because we have no idea what the future will bring.
But I’m a firm believer in the idea that the longer you extend your time horizon, the better your chances are of having a positive experience in the markets. And my level of confidence is much higher for a diversified portfolio than any single asset class or strategy.
Further Reading:
Playing the Probabilities
1Monthly total returns used for all time frames beyond daily, which uses price only index data.
2The best 10 year gains were all dates ending in the 1990s while the worst clustered in the 1930s.

