One of the reasons the fire-hose of information can actually make it harder to analyze the state of the world is because many people simply use point in time data instead of taking time to look at the overall trend.
Current data tells you very little unless you’re able to provide context about where it’s been and where it’s potentially going next.
I came across three rather interesting time lapses this week that do a nice job of showing past and future trends in the economy and the markets.
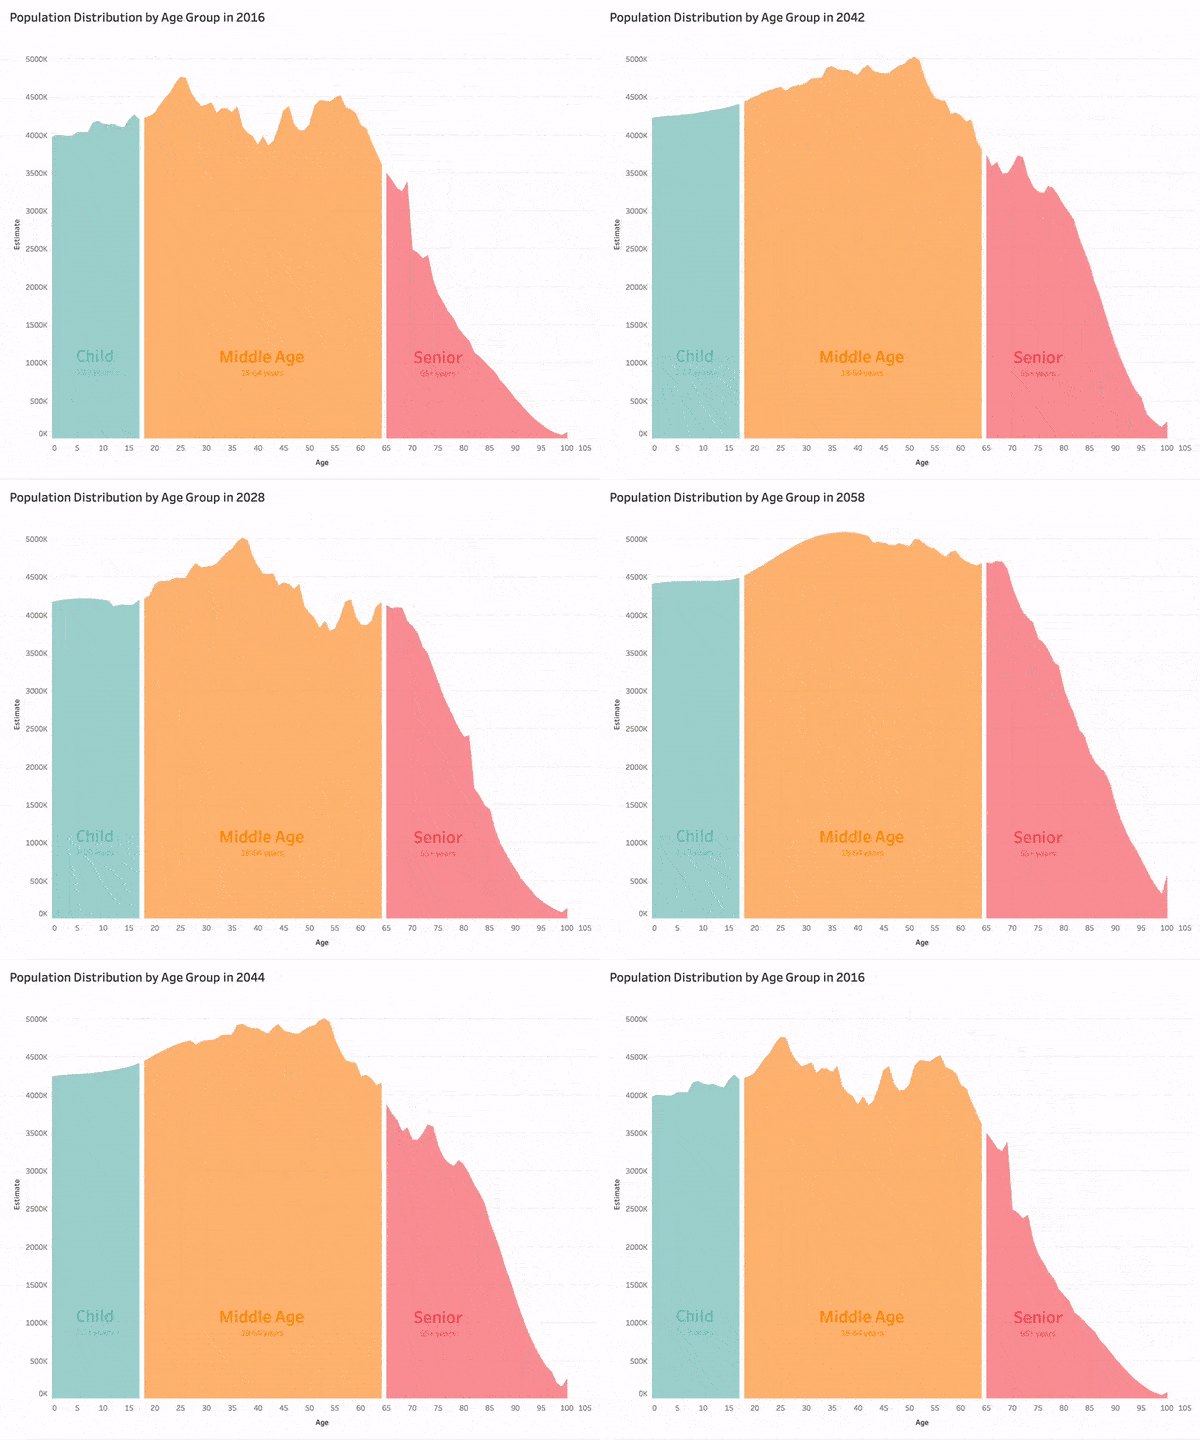
This one on the forward-looking population distribution in the U.S. is beautiful (courtesy of Bill Sweet via reddit):

A few takeaways:
- Look at that waterfall fill up the senior bucket of people 65 and over. Longevity risk may be the most important financial planning topic for the coming decades.
- The most common age in the U.S. right now is 27. In fact, by 2020, the 10 most common ages in the U.S. will all be 35 and under. A wave of young people will be saving, investing, and buying houses in the coming years. This fits with my theory that baby boomers will not destroy the stock market as they retire en masse because millennials actually outnumber them now.
- The housing market will always have its ups and downs but based purely on this demographic data my inclination would be to conclude real estate across the country will continue to rise in the coming decades as millennials begin settling down and starting families. That will put some massive pressure on the housing market where supply is relatively constrained following the real estate boom and bust of the 2000s.
This next one comes from Norbert Keimling at Star Capital and shows how stock market valuations have changed by country since 2007:
https://www.youtube.com/watch?v=pP5h1oO_Xbo&feature=youtu.be
A few takeaways:
- Watching U.S. stock valuations completely detach from the rest of the world (besides Denmark for some reason) since 2009 is something else.
- Comparing valuations across countries is difficult because of the fact that economies, sectors, regulations, and rule of law differ by region but watching valuations fall across the board during the financial crisis proves how terrible that time was to be an investor, basically anywhere in the world, in risk assets.
- The difference between the smoothed valuation changes and the monthly fluctuations provides a fantastic look at why it can be so hard to invest based on historical market data. These relationships can prove to be extremely unstable in the short-to-intermediate term so simply looking at the data on a spreadsheet tells you nothing about what it was like to live through those periods at the time.
Finally, this time lapse shows the change in the top 10 countries by GDP every year from 1960 to 2017 (hat tip Mark Shiffer):
Three things stood out to me after watching this one:
- The relative stability of the United States as the largest economy in the world is impressive. People have been calling for a downfall of the American empire for some time now but the U.S. has a lot of built-in advantages — a diversified, dynamic economy, a vibrant technology industry, a better demographic profile than the rest of the developed world, diversity and immigration (people still want to come live here), and our increasing role as a big player in the energy space to name a few.
- This graphic is like one of those water gun horse race games at the carnival and watching Japan make a run at the U.S. in the 1980s and 1990s before falling back to earth made things exciting for a while. People forget there were legitimate worries Japan was going to overtake America as the world’s largest economy for a period of time. Japan’s rise and fall is spectacular to watch on this context.
- Watching China’s growth is amazing. You can see China pop in and out of the top 10 a couple times in the 1990s before quickly supplanting the rest of the world’s economic powers in the 2000s. China has a far larger population than the U.S. albeit with demographic headwinds in the coming decades. There’s no way the growth they shown over the past few decades will continue but it will be interesting to see if they can catch the U.S. in the coming years in terms of economic size or completely blow up (as some have predicted).
