Since stocks topped out in late-January, U.S. stocks have moved around a lot but haven’t really gone anywhere. The S&P 500 is down roughly 5% from those levels but is still positive on the year (up around 2-3% depending on when you last checked).
International stocks have gotten hit even harder in recent months.
The MSCI EAFE Index of foreign developed markets is down nearly 12% since late-January and down 5% on the year.
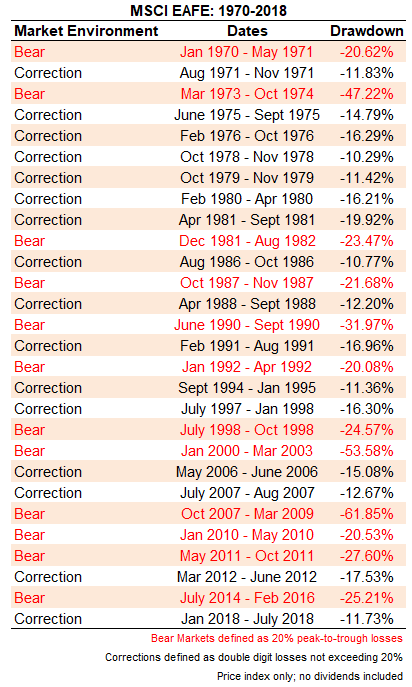
U.S. investors in foreign stock markets have had a rough go at it the last decade or so but losses are nothing new in international markets. I went through the historical data on the MSCI EAFE index going back to its inception in 1970 to look at the various corrections and bear markets that have occurred in this time frame:
By my calculations, there have been 12 full-fledged bear markets (as defined by losses of 20% or more) and 16 corrections which saw the EAFE fall double digits but less than the 20% threshold.
That compares to just six 20% losses for the U.S. using the S&P 500 (although there were 3 instances were stocks fell 19% and change) along with 19 corrections.
It’s also worth noting that foreign stocks have had three bear markets alone since the great recession while the U.S. has yet to technically enter bear territory (2011 was close).
I’m sure many investors would like to throw in the towel on investing internationally but I don’t think all hope is lost for a globally diversified portfolio. In my next piece, I’m going to dig deeper into these numbers to show why it still makes sense to diversify into foreign assets.
A Wealth of Common Sense is a blog that focuses on wealth management, investments, financial markets and investor psychology. I manage portfolios for institutions and individuals at Ritholtz Wealth Management LLC. More about me here. For disclosure information please see here.
Get Some Common Sense
Categories
Get a Full Investor Curriculum: Join The Book List
Every month you'll receive 3-4 book suggestions--chosen by hand from more than 1,000 books. You'll also receive an extensive curriculum (books, articles, papers, videos) in PDF form right away.