Trend-following is a strategy that got a lot of attention following the financial crisis. It’s something my views have evolved on over the years. There are a lot of misconceptions out there about what the typical trend-following signals actually mean. There’s much more nuance involved than simply looking at the moving average of the price of a stock or index. If you would like to use this type of strategy you have to be very thoughtful about implementation and understand the limitations involved. This piece I wrote for Bloomberg looks at the 200-day moving average, a favorite tool for many trend-followers.
*******
On April 2, the S&P 500 Index closed below its 200-day moving average for the first time in almost two years, and has been bouncing around that level ever since.
Traders and investors pay close attention to this key technical level as a market timing signal to get out of stocks before the onset of a large downturn. As the legendary hedge fund manager Paul Tudor Jones said:
The whole trick to investing is: ‘How do I keep from losing everything?’ If you use the 200-day moving average rule, then you get out. You play defense, and you get out.
Investors need to be careful about blindly following any indicator that gets them out of the market. There is no guarantee that markets are headed for a crash just because this trend was broken. There are no market timing signals that work every single time, so there’s no telling if the current correction will morph into an all-out bear market.
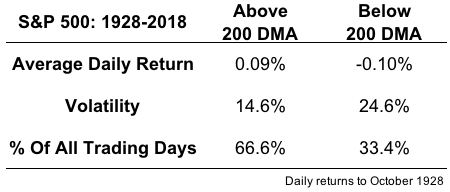
The 200-day benchmark works much better as an indicator of the type of market environment we are in than as a perfect timing signal. Here are the stats for the S&P 500 going back to 1928, when it was above and below the 200-day moving average:

Over the past 90 years or so, stocks have spent about two-thirds of the time above the 200-day mark and one-third of the time below. The volatility of all trading days in this time was 18.6 percent, so up-trending markets above the moving average showed higher average returns and lower than average volatility than markets below the moving average.
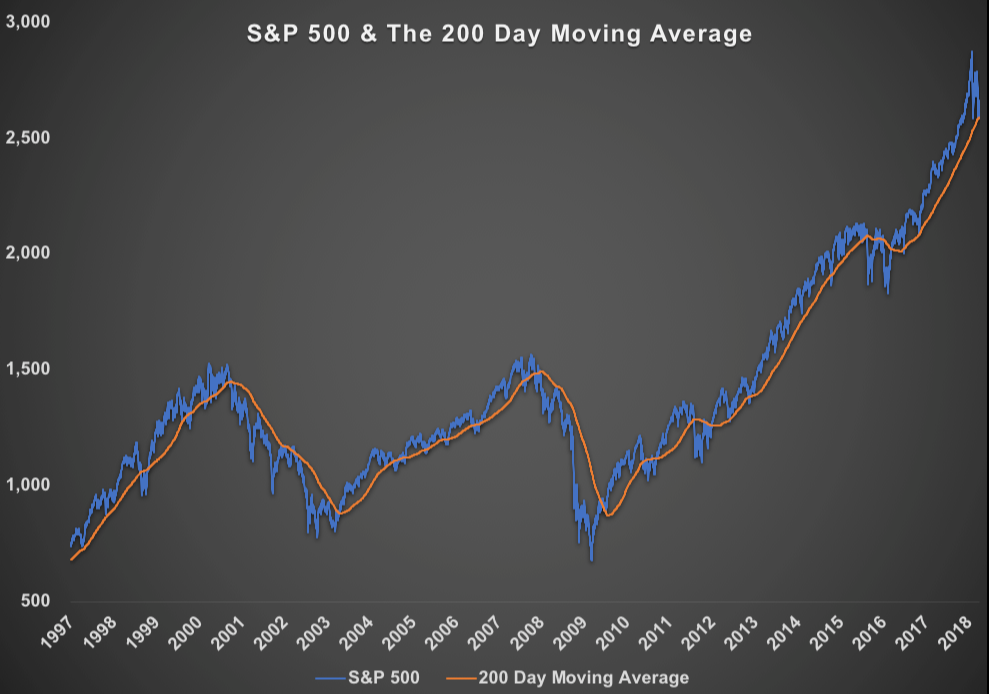
These signals often give investors a false sense of precision in the markets. The following shows the S&P 500 overlaid with the 200-day moving average going back to 1997:

An investor who used the 200-day as a signal to get out of the markets would have been able to miss the majority of the losses from the huge market crashes of both 2000-2002 and 2007-2009. But there were plenty of false-positive signals along the way. In fact, the S&P 500 has crossed the 200-day moving average 150 times since 1997.1 If this were a perfect signal, that would imply 75 separate market corrections.2
In reality, in that time, there were only 11 market corrections when stocks fell 10 percent or worse. That means the majority of the time when the S&P 500 went below the 200-day it was a head fake, when investors sold out of the market only to buy back higher.
Jeremy Siegel3, a professor at the Wharton School, tested the 200-day signal from 1886 through 2012 using the Dow Jones Industrial Average. To cut down on the number of false-positive signals and thus transactions, he applied a 1 percent band, meaning the Dow had to be at least 1 percent below the 200-day to trigger a sell, and 1 percent above the 200-day to trigger a buy signal. The positive from his research showed investors would have avoided some of the largest short-term market crashes in history — both Black Tuesday in October of 1929 and Black Monday in October of 1987. This signal would have also saved investors from the majority of the losses experienced in the last financial crisis.
Siegel’s results showed an annualized return of 9.7 percent from 1886-2012 for the timing model versus a 9.4 percent return for a simple buy and hold strategy. Once transaction costs were factored in, the timing model would have dropped to a return of 8.1 percent.4
This doesn’t mean the 200-day moving average doesn’t work. It just means that investors need to recalibrate their expectations when using these types of risk-management tools. If there were signals that got you out every time stocks fell, everyone would use them.
There are no silver bullets in the stock market. The 200-day moving average will be breached at some point during the next bear market. That’s a given. But it’s not a given that the most recent signal can assure investors a bear market is right around the corner. The majority of the time corrections don’t turn into crashes. History tells us that a false breakdown is a higher-probability event that further deterioration in the markets.
A more accurate reading of the current breakdown below the 200-day moving average is that investors should expect to see higher volatility for the time being now that markets are in a downtrend. The large swings from day to day in both gains and losses will likely be here to stay as long as markets are in a downtrending environment.
1And this data is based on closing prices. There would have been far more signals on an intraday basis.
2Because you sell when it goes below the 200-day and buy when it goes back above the 200-day.
3This research appeared in the fifth edition of Siegel’s book, “Stocks For the Long Run.”
4None of these results factor in taxes or the fact that were no index funds or ETFs for much of this testing period.
Watch me discuss this idea on Bloomberg TV for more:
Talking Lines on Charts and Lump Sums on What’d You Miss
Originally published on Bloomberg View in 2018. Reprinted with permission. The opinions expressed are those of the author.
