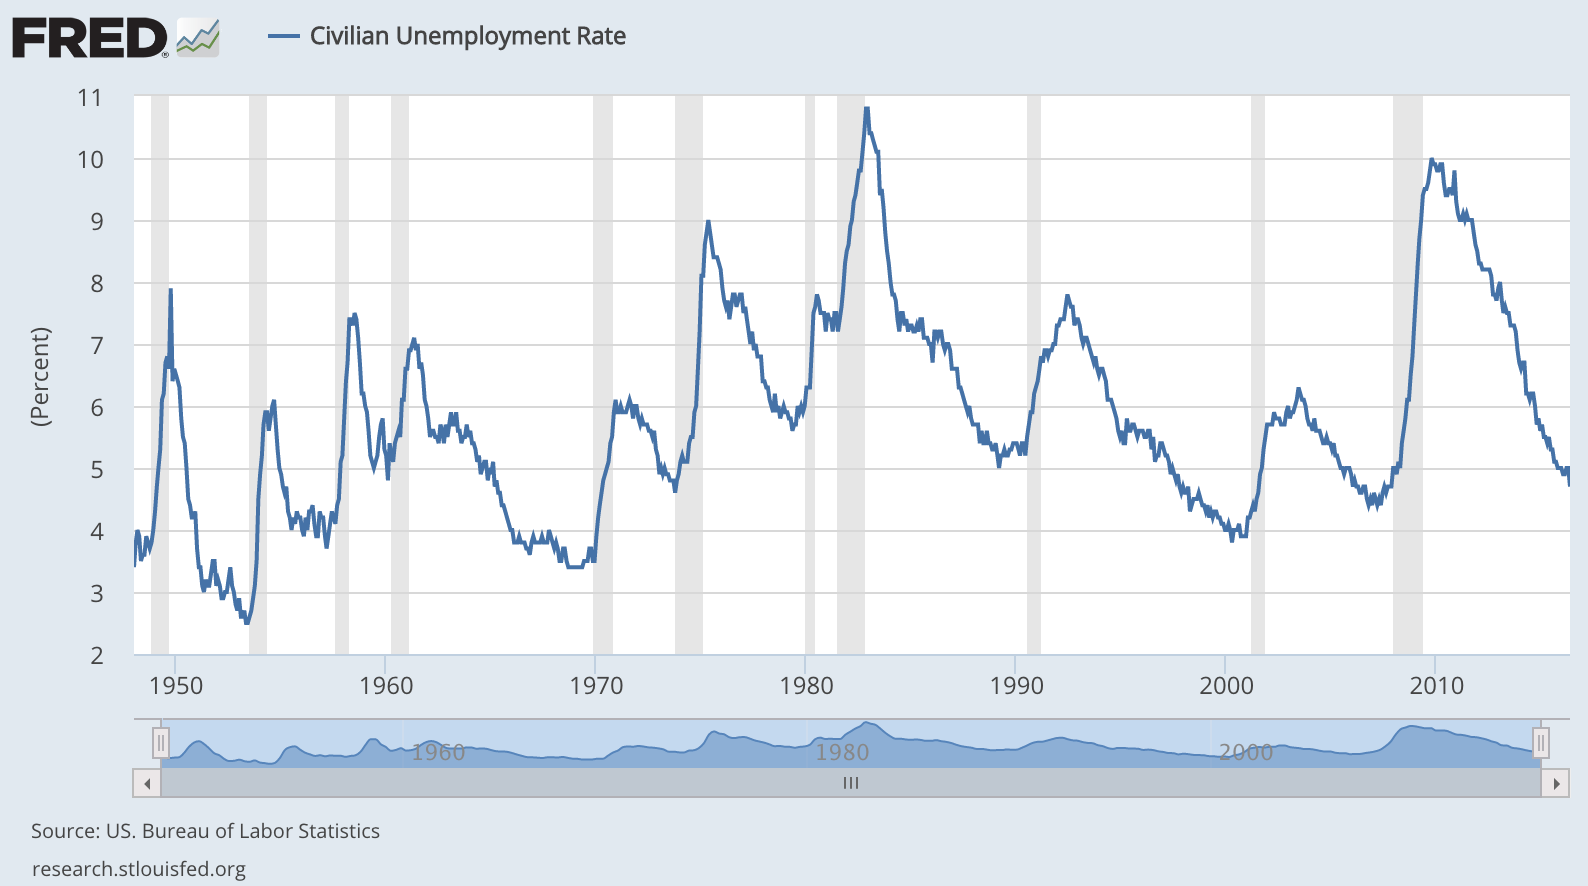
It may not feel like it for certain parts of the population, but the U.S. employment picture has continued to get stronger over the past few years. Job growth has averaged 150,000-250,000 jobs a month for the past 5 years or so. 2015 saw one of the best years for job growth since 1999. According to the latest jobs report, the unemployment rate is now down to 4.7%:
These numbers are far from perfect, but unless you subscribe to conspiracy theories it’s hard to argue that things haven’t improved after taking into consideration the demographic make-up of the labor force. People have dropped out of the labor force, but baby boomers are also retiring and young people are going to school for much longer than they did in the past.
Regardless of your thoughts on government labor statistics, the unemployment numbers have had an impact on stock market returns historically. I covered this relationship in my book:
The stock market anticipates future events and discounts them today. It doesn’t always get them correct, but that’s never stopped investors from trying. Markets don’t usually perform the best when they go from good to great. They actually show the best performance when things go from terrible to not-quite-so-terrible as before. And it’s not the absolute level of improvement that matters— it’s whether things are getting better or worse. If things are just getting less worse, investors perceive this as a positive because there’s nowhere to go but up. For example, since 1950 the average unemployment rate is just over 6 percent. When the unemployment rate has been below average, the S& P 500 is up 6 percent annually, much lower than the long-term average of almost 10 percent per year in that time. When the unemployment rate has been above average, the annual performance of stocks jumps to over 16 percent per year. An unfortunate truth of the stock market is that the best time to buy is when conditions are at their worst.
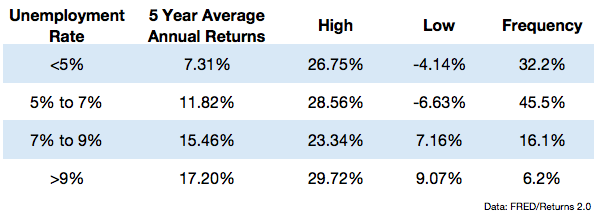
I shared a chart in the book that shows how stocks have performed under various unemployment rate levels. But I also wanted to see how stocks performed out into the future from different unemployment thresholds. So I looked back at the S&P 500 from 1948-2016 and calculated the 5 and 10 year return numbers from certain unemployment rate ranges. Here are the results going 5 years out from the unemployment rate ranges listed:
And here are the 10 year numbers:
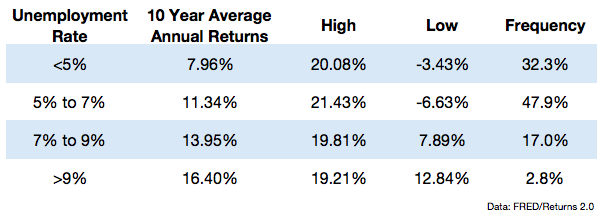
Both tables tell a similar story. When the unemployment rate is high, subsequent market returns tend to be higher and when it’s low, subsequent market returns tend to be lower. You get far fewer chances to earn higher returns because recessions and economic calamities occur less often than the stable times. Averages don’t always tell the entire story so I think it’s also important to look at the range of outcomes to get a better sense of what these numbers are telling us.
At lower unemployment rates, the range of outcomes tends to increase and there is a higher chance of seeing negative future returns. For example, roughly 20% of starting points from an unemployment rate below 5% saw negative returns 5 years out. But when the unemployment rate has been 7% or higher, there was not a single negative return going out 5 years over this time frame. On the other hand, there were still periods that saw excellent stock market returns from very low unemployment numbers.
Since 1948 almost one out of every three years has seen the U.S. economy with an unemployment rate of 5% or lower, so it’s not like the current state of affairs is an outlier by any means. The point here is not that you can use these numbers to predict future returns from the current unemployment rate; it’s that you can use today’s environment to set more realistic expectations about future returns. When unemployment is high, the economy is typically in the midst of a recession, which is when the bulk of the bear markets occur. Buying during a bear market can be difficult, but that’s also when you earn better returns. When job growth is strong for a number of years, the economy is usually growing, as is the stock market. After stocks run up in price, the future returns tend to be lower. A simple, but not easy relationship to remember as an investor.
The other lesson here is that you should be on the lookout for countries that are experiencing economic problems if you wish to seek out higher equity returns in the future. Countries in turmoil are probably going to offer much better returns over the next part of the cycle, even though it feels much safer to invest in the U.S.
Further Reading:
When Will The U.S. Have Its Next Recession?

