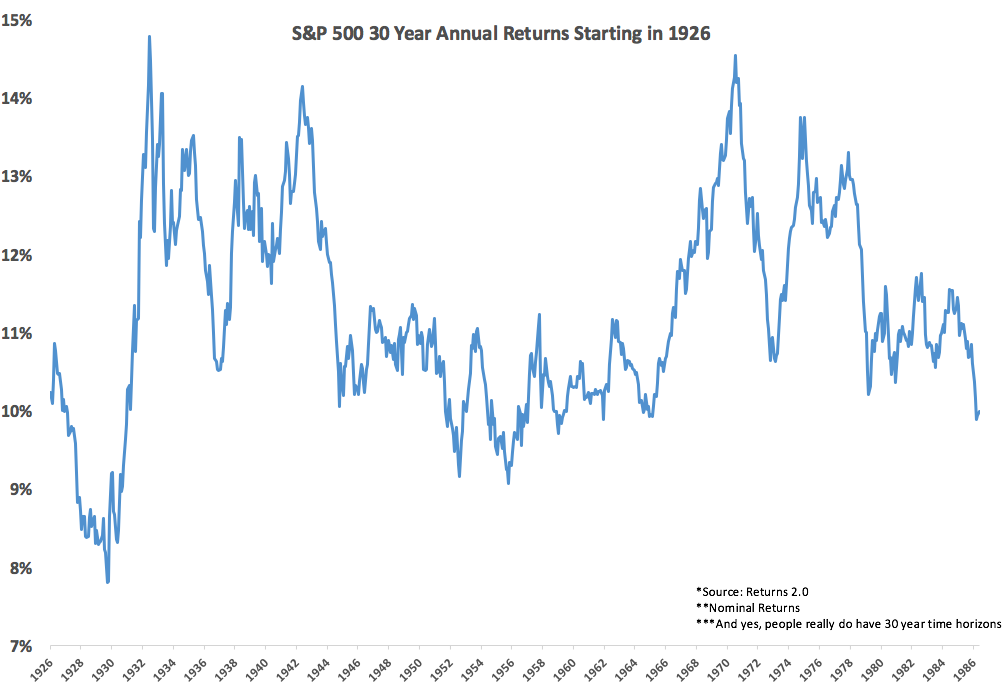
One of the most impressive long-term stock market statistics has to be the historical 30 year returns on the S&P 500:

This graph shows the rolling annual 30 year returns from the corresponding start dates.
The worst 30 year return — using rolling monthly performance — occurred at the height of the market just before the Great Depression and stocks still returned almost 8% per year over the ensuing three decades.
You can see that there is some variation in these returns throughout this period, but the volatility of the results is quite impressive — less than a 5% standard deviation in the return figures.
Everyone seems to assume that the returns from the early 1980s mark a golden age of stock market performances. And it’s true that the returns in the 80s and 90s were off the charts, close to 18% annually over two decades. But if you look at the 30 year annual return that started in 1982 — which is when many say that bull market started — the 10.98%/year performance from 1982-2012 ranks right in the middle of the historical numbers. In fact, it’s the median value.
The 30 year returns were much higher for the start dates that coincided with the bear markets of the late-1960s and mid-1970s.
Some will argue that these numbers are somewhat misleading because many of these periods are overlapping with one another. If you break things down into non-overlapping periods there have really only been three separate 30 year periods in this data set. So I calculated the annual returns from each of those three 30 year periods to see how they stacked up:
- 1926-1955: +10.2%
- 1956-1985: +9.5%
- 1986-2015: +10.4%
The consistency of returns is fairly remarkable when you consider some of the events that have transpired in each of those 30 year periods:
1926-1955: The Great Depression, a stock market crash of more than 80%, World War II, The Korean War and four recessions.
1956-1985: The Civil Rights Movement, the Vietnam War, a president was assassinated and another forced to resign, an oil price shock from the OPEC embargo, double-digit inflation and interest rates and six recessions.
1986-2015: Black Monday in 1987, the Savings & Loan crisis, Desert Storm, 9/11, wars in Iraq and Afghanistan, the Great Financial Crisis and three recessions.
The usual caveats apply here:
- Past is not prologue.
- We’re a more mature economy now.
- There were no index funds until the mid-1970s.
- Costs were much higher in the early days.
- These numbers don’t take into account inflation, taxes, fees, etc.
- The winners write the history books.
- 90 years is a small sample size in the grand scheme of things.
- 30 years is a long time to hold an investment.
We are promised nothing as investors in terms of future returns. Things could certainly be worse from this point forward. You just never know.
Still, it’s hard to look at these numbers and not be optimistic about the future. Bad things happen and human progress continues to march on.
Further Reading:
Playing the Probabilities
