Risk-adjusted return measures have been around for some time now, but following the financial crisis professional money managers and asset allocators zeroed in on these formulaic performance metrics like never before. One of the most well-known risk-adjusted return formulas, the Sharpe Ratio, is simple a measure of return per unit of risk. It takes the annual returns on an investment, subtracts the risk free rate of return (in most cases that’s cash or t-bills) and divides that by the investment’s standard deviation or volatility.
Far too many investors confuse risk measurement with risk management so I’ve never been completely sold on volatility as a measure of risk, but plenty of people have become enamored with it because it provides something tangible they can define. My problem is that volatility can’t measure consequences, only the variation in returns. It says nothing of the other risks you took to get that variation. Volatility only matters when it causes investors to make unforced errors, so in that sense it can be a type of risk, both in terms of investor behavior and career risk for portfolio managers.
So I’m not saying you can’t look at volatility as a way to understand the markets. You just never make it your sole determination for making a decision one way or another. Assuming you do subscribe to volatility as a measure of risk, the current market environment ranks as one of the lowest risk periods of the past forty years and could end up being the lowest volatility-adjusted cycle ever.
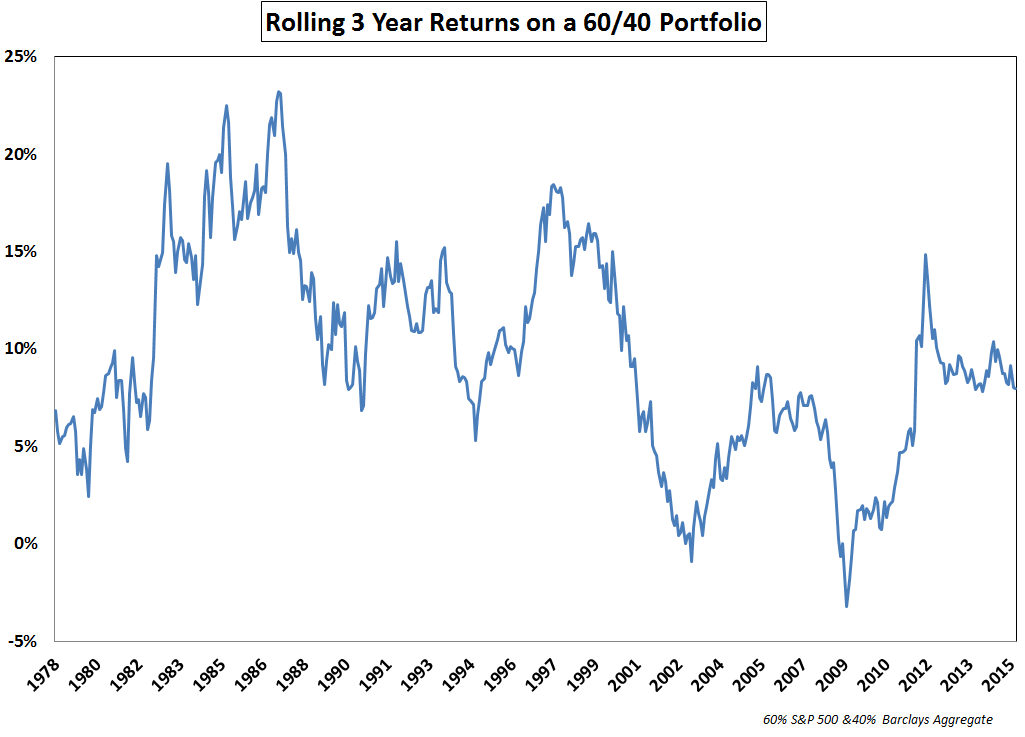
These are the rolling three year annualized returns on a 60/40 stock/bond portfolio comprised of the S&P 500 and the BC Aggregate Bond Index:

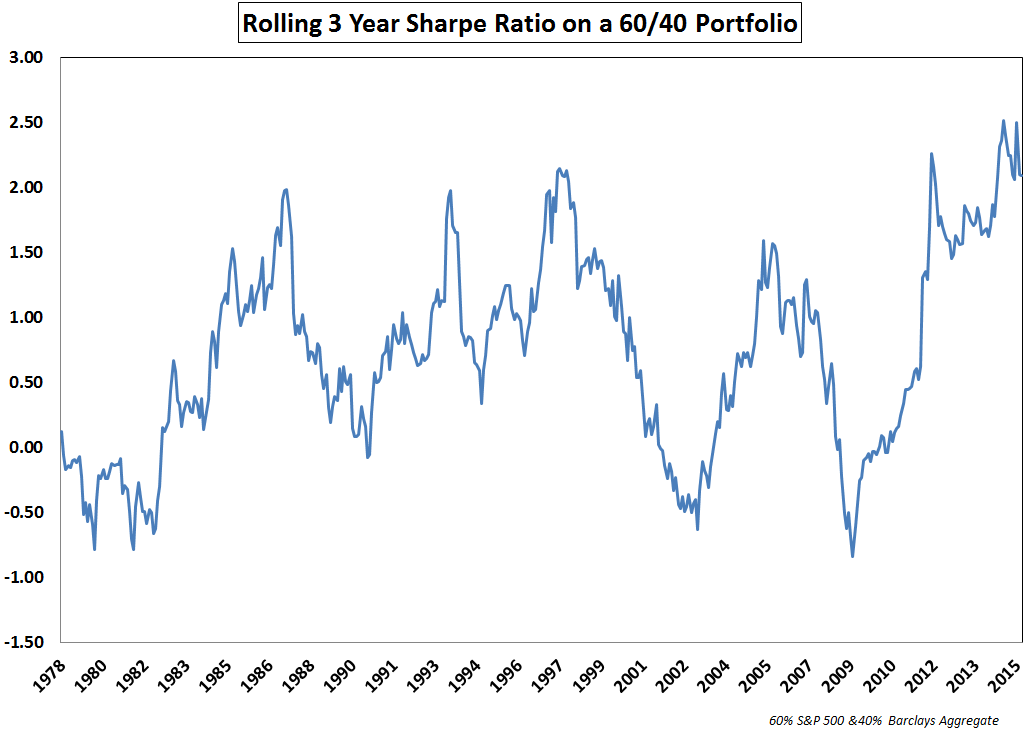
Returns on this simple portfolio have actually been fairly average over the past few years, with higher than average stock gains, but lower than average bond performance. But take a look at the risk adjusted returns using the same time frame:

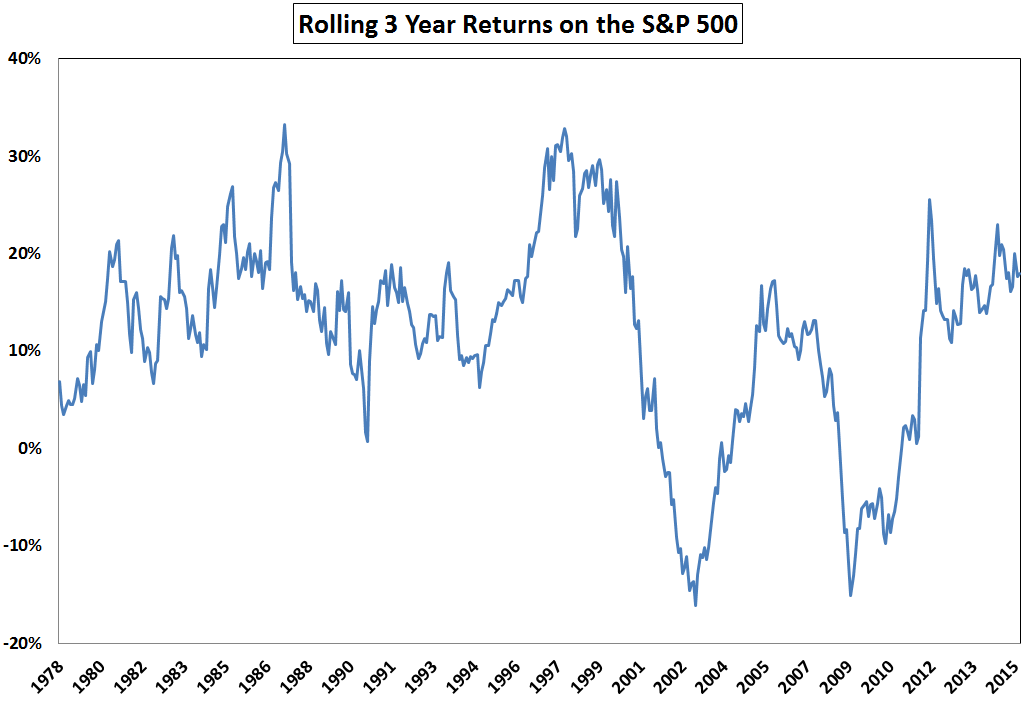
We’ve witnessed the highest Sharpe Ratios on record going back to the mid-1970s. Of course, any time volatility is used as a measure of risk, stocks are going to completely dominate that equation. Here are the three year returns for the S&P 500:

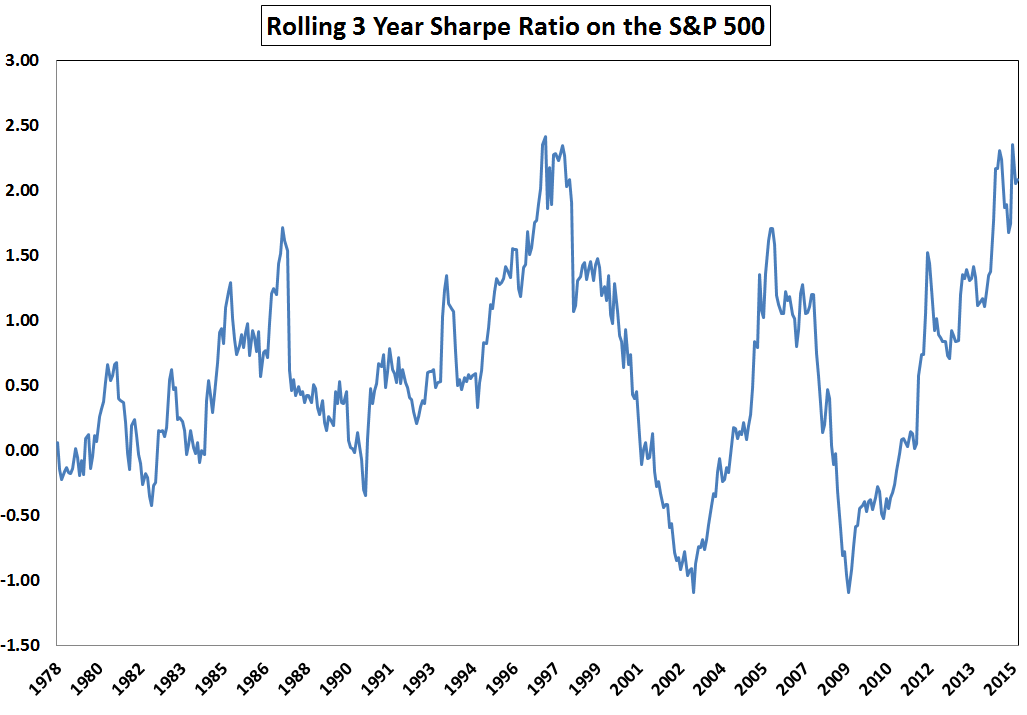
And the rolling three year Sharpe Ratio on stocks:

Stocks are also right around their peak Sharpe Ratio in this window of time. This makes sense in theory — we’ve had high returns, low volatility and extremely low or non-existent risk free returns. Add all of those up and you have the perfect recipe for high absolute and risk-adjusted returns.
This is actually one of the reasons I’m so skeptical of utilizing these types of risk measures. Investors could claim that is was their superior risk management abilities or investment expertise that led to such amazing risk-adjusted returns, when in fact it was all of product of the market environment. I’m not saying you should ignore volatility-based measures of performance, but they always need to be put into context. Nothing is ever as easy as it appears in a ratio.
There’s a running joke in the investment industry that everyone spends all their time researching, benchmarking to and talking about the 60/40 stock/bond mix but no one actually invests in that portfolio. There may be some truth to that statement if you consider cash, real estate and other diversified investment options. If nothing else, 60/40 provides something of a default balanced portfolio option for comparison purposes. It’s also been pretty tough to beat these past few years.
I hate the phrase “the easy money has been made,” because investing is never easy. Just go back and look at some of the headlines and fear-mongering that’s been going on during this recovery. It was never easy no matter what the data says. But if you have a U.S.-centric portfolio that’s heavily allocated to stocks and bonds it’s likely you just lived through one of the lowest risk periods ever to invest in — from a textbook perspective.
Further Reading:
Do Risk-Adjusted Returns Matter?
Two Finance Phrases I Could Do Without

Really interesting post. I find Sharpe really helpful as a way of normalised claimed performance figures and hadn’t seen the 60:40 results before.
One thing I’m puzzled by though: S&P has been almost flat this year, ie returns are far lower than the last three years. I’d expect to see the rolling 3 year results to be showing a dip. But they barely are. What am I missing?
Strong gains at the end of 2012 and huge 2013 still helping. With a 3 yr window it will still take some time to work off the impressive 2013 gains even in a flat market.
All i look at is $. I buy $ worth of assets or discounted cashflows for cents. I then look at my net worth at intervals and see how much I grew by. I then check my win/loss ratio, to see my % error rate. That’s all that matters.
Doesn’t “win/loss” depend upon time period? What time period do you use?
From the chart is looks like the Sharpe is at a multi-year peak, meaning either returns go down from here, or volatility goes up. Is there a portfolio move that could hedge this possibility?
Luck? It’s a great question but in my mind the volatility part of the equation depends on upside or downside volatility.
Great timing on this article Ben! 🙂
Better to be lucky than good sometimes
[…] Risk-adjusted returns have rarely been this high. Buckle up. (awealthofcommonsense) […]
Intriguing article! What measures of risk do you like to use?
Good question. Some more thoughts here:
https://awealthofcommonsense.com/three-misconceptions-about-risk-management/
and here:
https://awealthofcommonsense.com/the-struggle-to-define-risk/
Great thanks! Excited to read your book! Just finished Wesley Gray’s Quantitative Value
Thanks. Wes wrote a great book. Let me know what you think of mine when you’re finished.
Ben: how did you calculate the rolling Sharpe Ratio?
Annual returns dividing by annualized standard deviation.
where did you get annual standard deviation information?
Monthly returns
I agree with you, but I would go further. Simply, most investment risk measures are based on volatility, and volatility is NOT risk. Risk is the odds that the investor will not achieve his end-goal with that investment at the the desired time. Volatility is the amount that an investment may go up/down over a period of time, which may be measure of what the investor can stomach, but is definitely not risk. In fact, an investment that has a meteoric breakout rise will have high volatility (even though it is on the upside), but I think most investors would not consider a breakout to the upside a “risk” problem.
Or to take a different example of how volatility is not at all the same as risk, if an investor needs a 5% after inflation return to be able to retire, but invests only in Certificates of Deposit, there will be very low volatility, but almost infinite risk, since in today’s environment one cannot buy CDs that will return anything close to 5% after inflation, and his investment goal will not be achieved. On the flip side, if he invests 100% in the S&P 500 index, he will likely have substantial volatility, but if his timeframe to achieve his goal is long enough, fairly low risk.
I think the professional investment community is surprisingly obtuse when it comes to equating volatility with risk, which is incorrect. Investment risk and volatility should be looked at as two discrete factors to consider, risk being chance of success, and volatility as an indicator for each particular investor as to his emotional ability to stick with the strategy. The two should not be confused with each other.
Agreed and nice examples. It makes everyone’s job a little easier when you can attach a number to something. People get uncomfortable with trying o define goals and track progress that can be years into the future and only estimated with probabilities for success. So a bunch of smart quants filled the void with fancy formulas.
[…] over Growth (Advisor Perspectives) • Did We Just Witness the Best Risk-Adjusted Returns Ever? (A Wealth of Common Sense) but see U.S. Lacks Ammo for Next Economic Crisis (WSJ) • Stop Kidding Yourself. A Classic Car […]
[…] Did we just witness the best risk-adjusted returns ever? (awealthofcommonsense) […]
[…] After a period of relative calm for the past 5-6 years, it makes sense that we would eventually see increased volatility in the markets. It was only a matter of time considering it has occurred roughly one out of every three years in the past. […]
[…] Following heavy losses in the 2007-2009 period many endowments realized they couldn’t handle volatility so they changed their strategy near the bottom by investing more in downside volatility protection. What many failed to realize is that market rallies tend to exhibit lower volatility, so many missed out on some of the best risk-adjusted returns ever in the stock and bond markets. […]